Fig. 4.

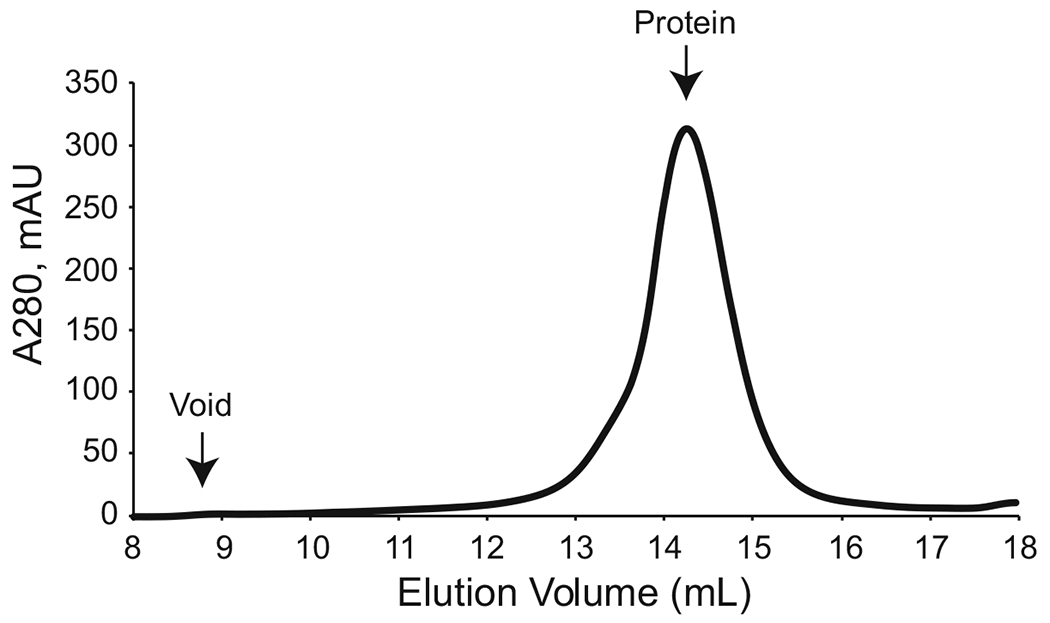
Size exclusion chromatography. A representative size exclusion chromatogram is shown; the peak corresponds to fractions 14–15 mL. Elution fraction will vary based on size of protein

Size exclusion chromatography. A representative size exclusion chromatogram is shown; the peak corresponds to fractions 14–15 mL. Elution fraction will vary based on size of protein