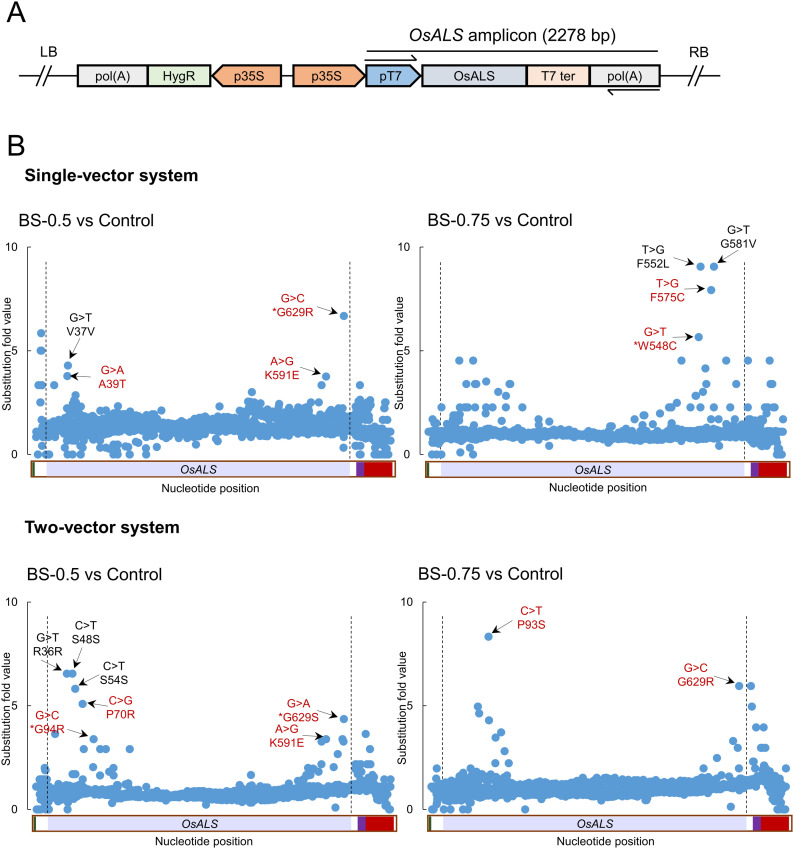
Figure 3. Identification of bispyribac sodium (BS)-responsive regions at the OsALS locus.
(A) The OsALS amplicon fragment in the T-DNA is shown. The arrows represent the primers used to amplify the acetolactate synthase sequence from the transgene. (B) The callus was transformed using the single-vector or two-vector system. After 2 wk of selection, five proliferated callus pieces on selection medium containing 0.5 and/or 0.75 μM BS were selected and pooled into a single sample. Five proliferated callus pieces on selection medium without BS were pooled into a single sample and used as a control. The data were analyzed by comparing the BS-treated versus control samples. The substitutions in the red cause amino acid changes, whereas in black are silent mutations.
Source data are available for this figure.

