
Figure 8.
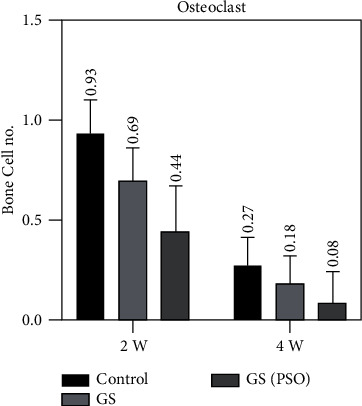
A bar chart representation of the mean and standard deviation of bone cells after 2- and 4-week time intervals for osteoclast, considering the C, GS, and GS/PSO groups.
Official websites use .gov
A
.gov website belongs to an official
government organization in the United States.
Secure .gov websites use HTTPS
A lock (
) or https:// means you've safely
connected to the .gov website. Share sensitive
information only on official, secure websites.
A bar chart representation of the mean and standard deviation of bone cells after 2- and 4-week time intervals for osteoclast, considering the C, GS, and GS/PSO groups.