Figure 9.

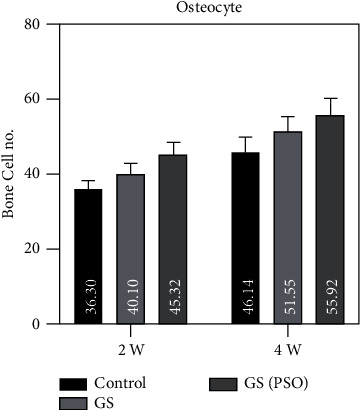
A bar chart representation of the mean and standard deviation of bone cells after 2- and 4-week time intervals for osteocyte, considering the C, GS, and GS/PSO groups.

A bar chart representation of the mean and standard deviation of bone cells after 2- and 4-week time intervals for osteocyte, considering the C, GS, and GS/PSO groups.