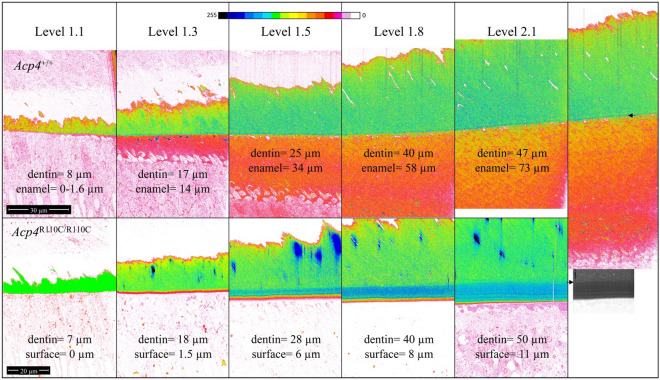
Figure 11.
Pseudocolored FIB-bSEM Images of the DEJ Region in Acp4+/+ and Acp4R110C/R110C Mandibular Incisors. Images of various sites along DEJ from Level 1.1 (start enamel formation) to Level 2.1 (mid secretory stage) are presented (all at 1500×). The image in the righthand panel shows the full thickness of dentin and enamel layers in Acp4+/+ mice at Level 2.1. Beneath it is grey scale image illustrating the difficulty of trying to decide where the DEJ is located because of multiple variations in image intensity across the aplastic enamel layer. Measurements of dentin thickness in the pseudocolored images provides a direct method to delineate this boundary. These measurements provide evidence that dentin formation appears normal within the Acp4R110C/R110C mice and that loss of ACP4 function leads to production of little more than a dysfunctional initial enamel layer on the surfaces of mutant teeth. Inverted backscatter intensity pseudo color ramp is shown at the top of the figure.

