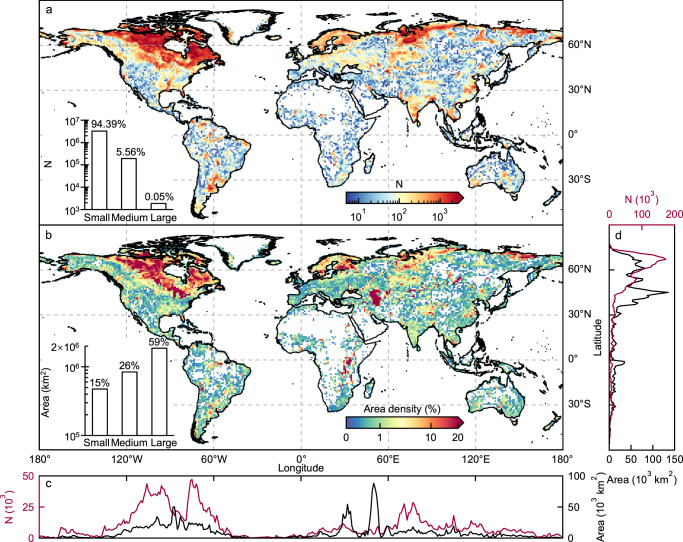
Fig. 1. Spatial distribution of global lakes.
Lakes with maximum surface area >0.03 km2 were mapped, showing a lake count (total number of lakes) and b lake area density (total lake area/grid area) per 1° × 1° grid cell. The longitudinal and latitudinal lake profiles summarizing (by 1°) the lake count and lake area are shown on c and d. Statistics for small (<1 km2), medium (1–100 km2), and large (>100 km2) lakes are presented within each panel of a and b.

