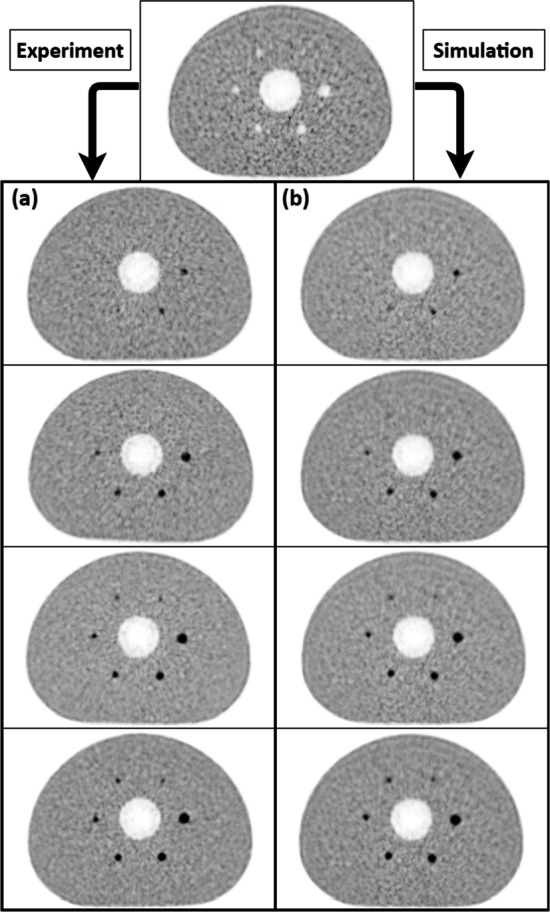
Fig. 4.

Visual comparison of BPL averaged reconstructed images: a Experimental series (from top to bottom, respectively, SBR 2:1, 4:1, 6:1 and 8:1). b Simulated series (from top to bottom, respectively, SBR 2:1, 4:1, 6:1 and 8:1)

Visual comparison of BPL averaged reconstructed images: a Experimental series (from top to bottom, respectively, SBR 2:1, 4:1, 6:1 and 8:1). b Simulated series (from top to bottom, respectively, SBR 2:1, 4:1, 6:1 and 8:1)