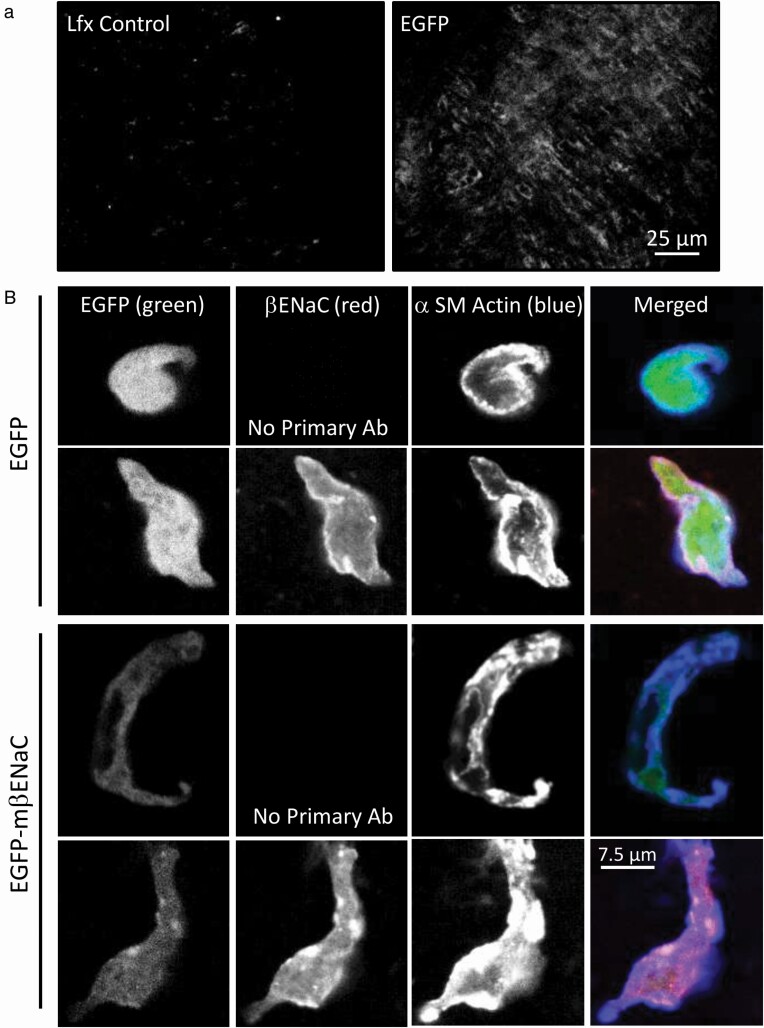
Figure 2.
Cerebral artery segments and dispersed VSMCs show EGFP and βENaC expression following transfection with EGFP or EGFP–mβENaC. (a) Representative fluorescence images of cerebral artery segments showing EGFP expression following EGFP (a, right), but not Lfx (a, left), treatment. EGFP was visualized using confocal microscopy and samples were imaged side-by-side under identical conditions. (b) Enzymatically dissociated VSMCs from EGFP control and EGFP–mβENaC transfected cerebral artery segments, immunolabeled for mβENaC and α-SM actin, then visualized using confocal microscopy. Panel columns represent EGFP (left, green), mβENaC (middle left, red), α-SM actin (middle right, blue), and merged (right) images. Single color images are shown as black and white for visual sensitivity and the merged images are presented in color. Panel rows represent EGFP control (top rows) and EGFP–mβENaC (bottom rows), no-primary antibody controls for both transfection conditions are also shown. EGFP fluorescence intensity is higher and localized to the cytoplasm in EGFP transfected (top rows), while intensity is lower and localized at or near the cell membrane with α-SM actin in EGFP–mβENaC transfected (bottom rows) VSMCs. Lfx, Lipofectamine 3000; EGFP, enhanced green fluorescent protein; VSMC, vascular smooth muscle cell; mβENaC, mouse beta-epithelial Na+ channel.

