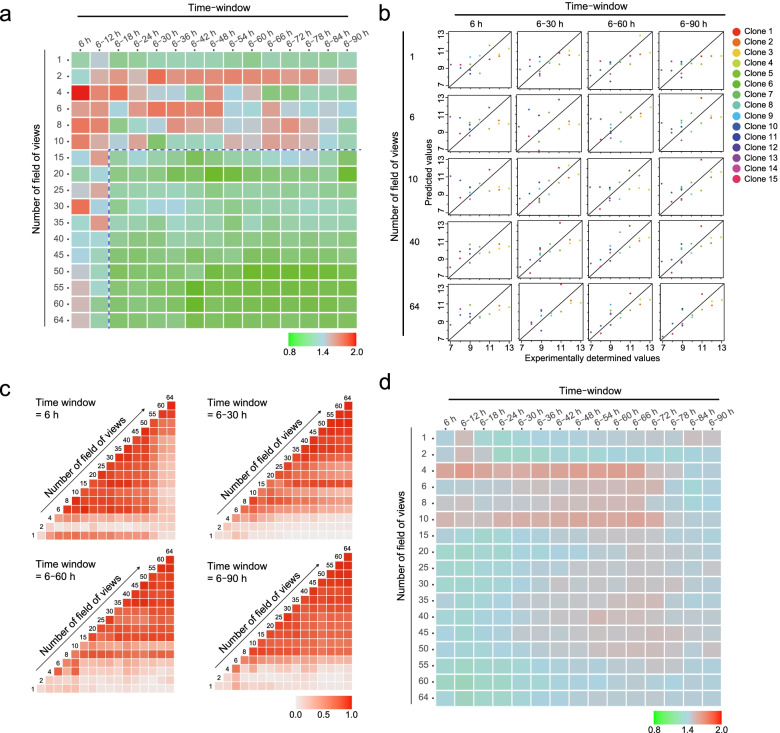
Fig. 4.
Exhaustive evaluation of the data-usage effect and performances of serial-passage prediction models. a Evaluation of data-usage effect with LASSO. The row values represent the number of FOVs used, and the column values represent the time-window size used for training data. The heatmap indicates the RMSE. RMSE < 1.0 is considered a good performing model. b Scatter plots to visualize the serial-passage prediction model performances; each dot represents one clone. c Comparison of model structures between two pairs of constructed models in a. Time windows of 6, 6–30, 6–60, and 6–90 h were selected. The heat map indicates the correlation coefficiencies between all weights on all selected morphological descriptors in the model. The correlation coefficiencies become high if the used descriptor combination is similar. d Evaluation of the data-usage effect with RF; the row indicates the number of FOVs used, and the column represents the time-window size used for training data. The heatmap indicates the RMSE. RMSE < 1.0 is considered a good performing model

