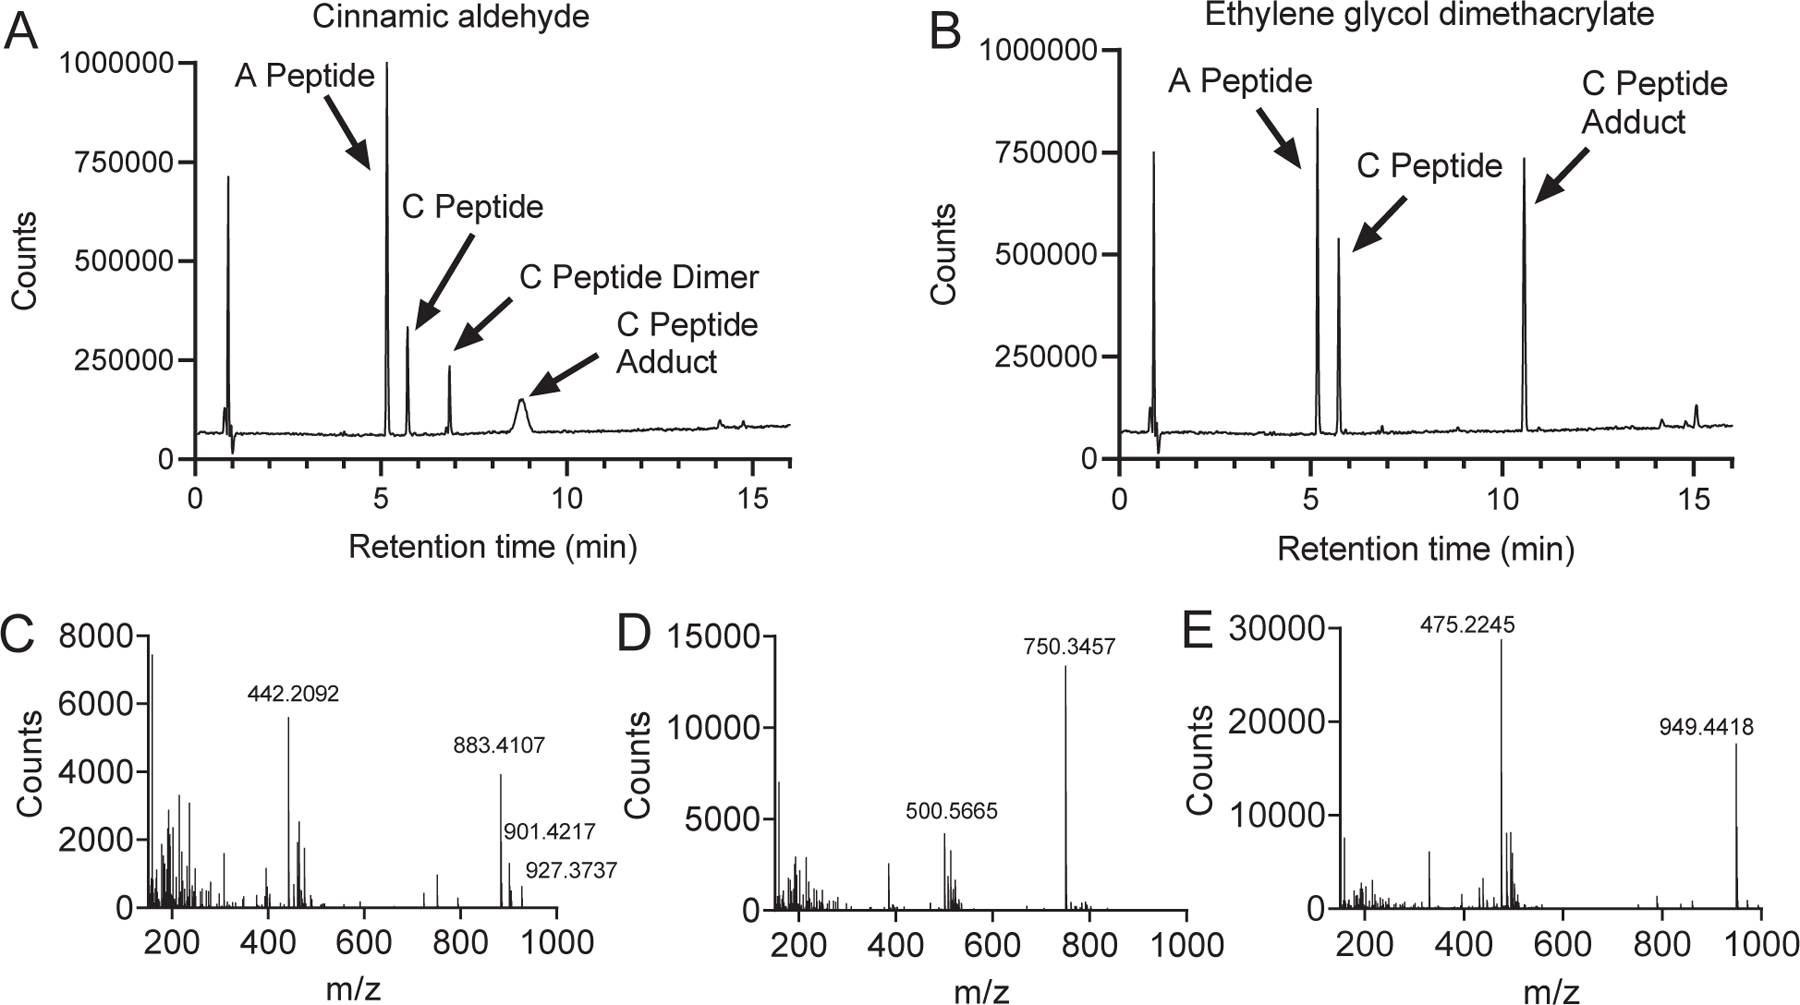
Figure 6.

HPLC-TOF-MS spectrum of mixture of chemical-cysteine peptide mixtures. (A) Total Ion Chromatogram (TIC) of the alanine peptide (A peptide) and cysteine peptide (C peptide) mixture with cinnamic aldehyde after 24 h incubation. (B) TIC of the alanine peptide (A peptide), cysteine peptide (C peptide) mixture with ethylene glycol dimethacrylate (EGD). (C) Mass spectra of a selected peak of cinnamic aldehyde adduct with C peptide at the retention time of 8.765 min. (D) Mass spectra of a selected peak of C peptide dimer induced by cinnamic aldehyde at the retention time of 6.851 min. (E) Mass spectra of a selected peak of EGD adduct with C peptide at the retention time of 10.573 min.
