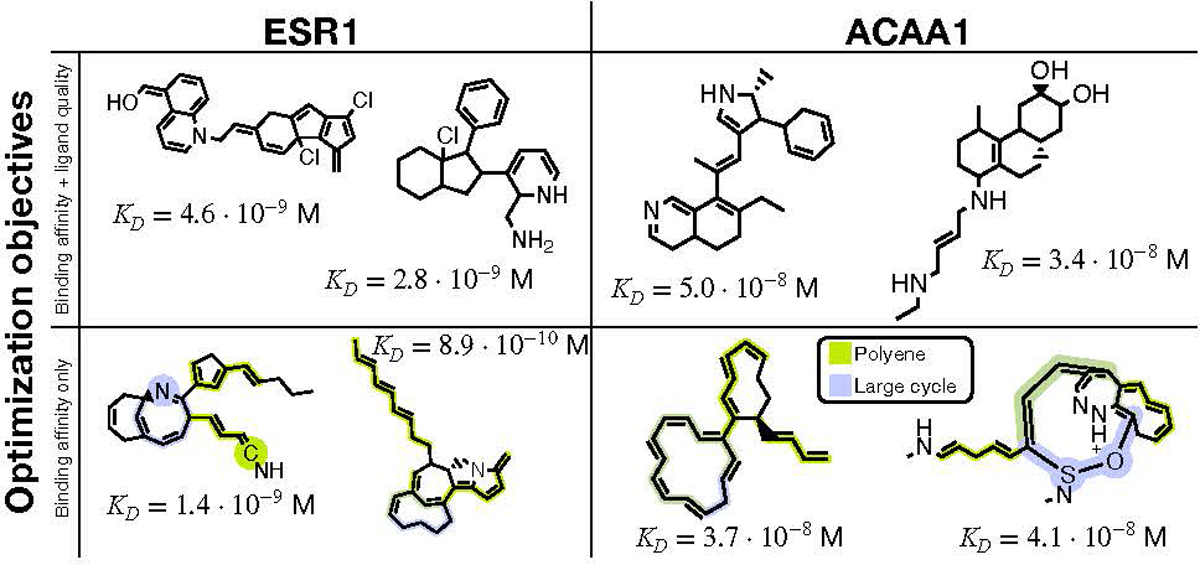
Figure 3.

Generated molecules from the multi-objective (top row) and single-objective (bottom row) binding affinity maximization. The estimated dissociation constants, KD, were obtained by docking each compound to the targeted protein using AutoDock-GPU. The dissociation constant is a measure of binding affinity, where lower is better. In the bottom row, we highlight two major problematic patterns that appeared when only considering computed binding affinity, motivating multi-objective optimization.
