
Figure 2.
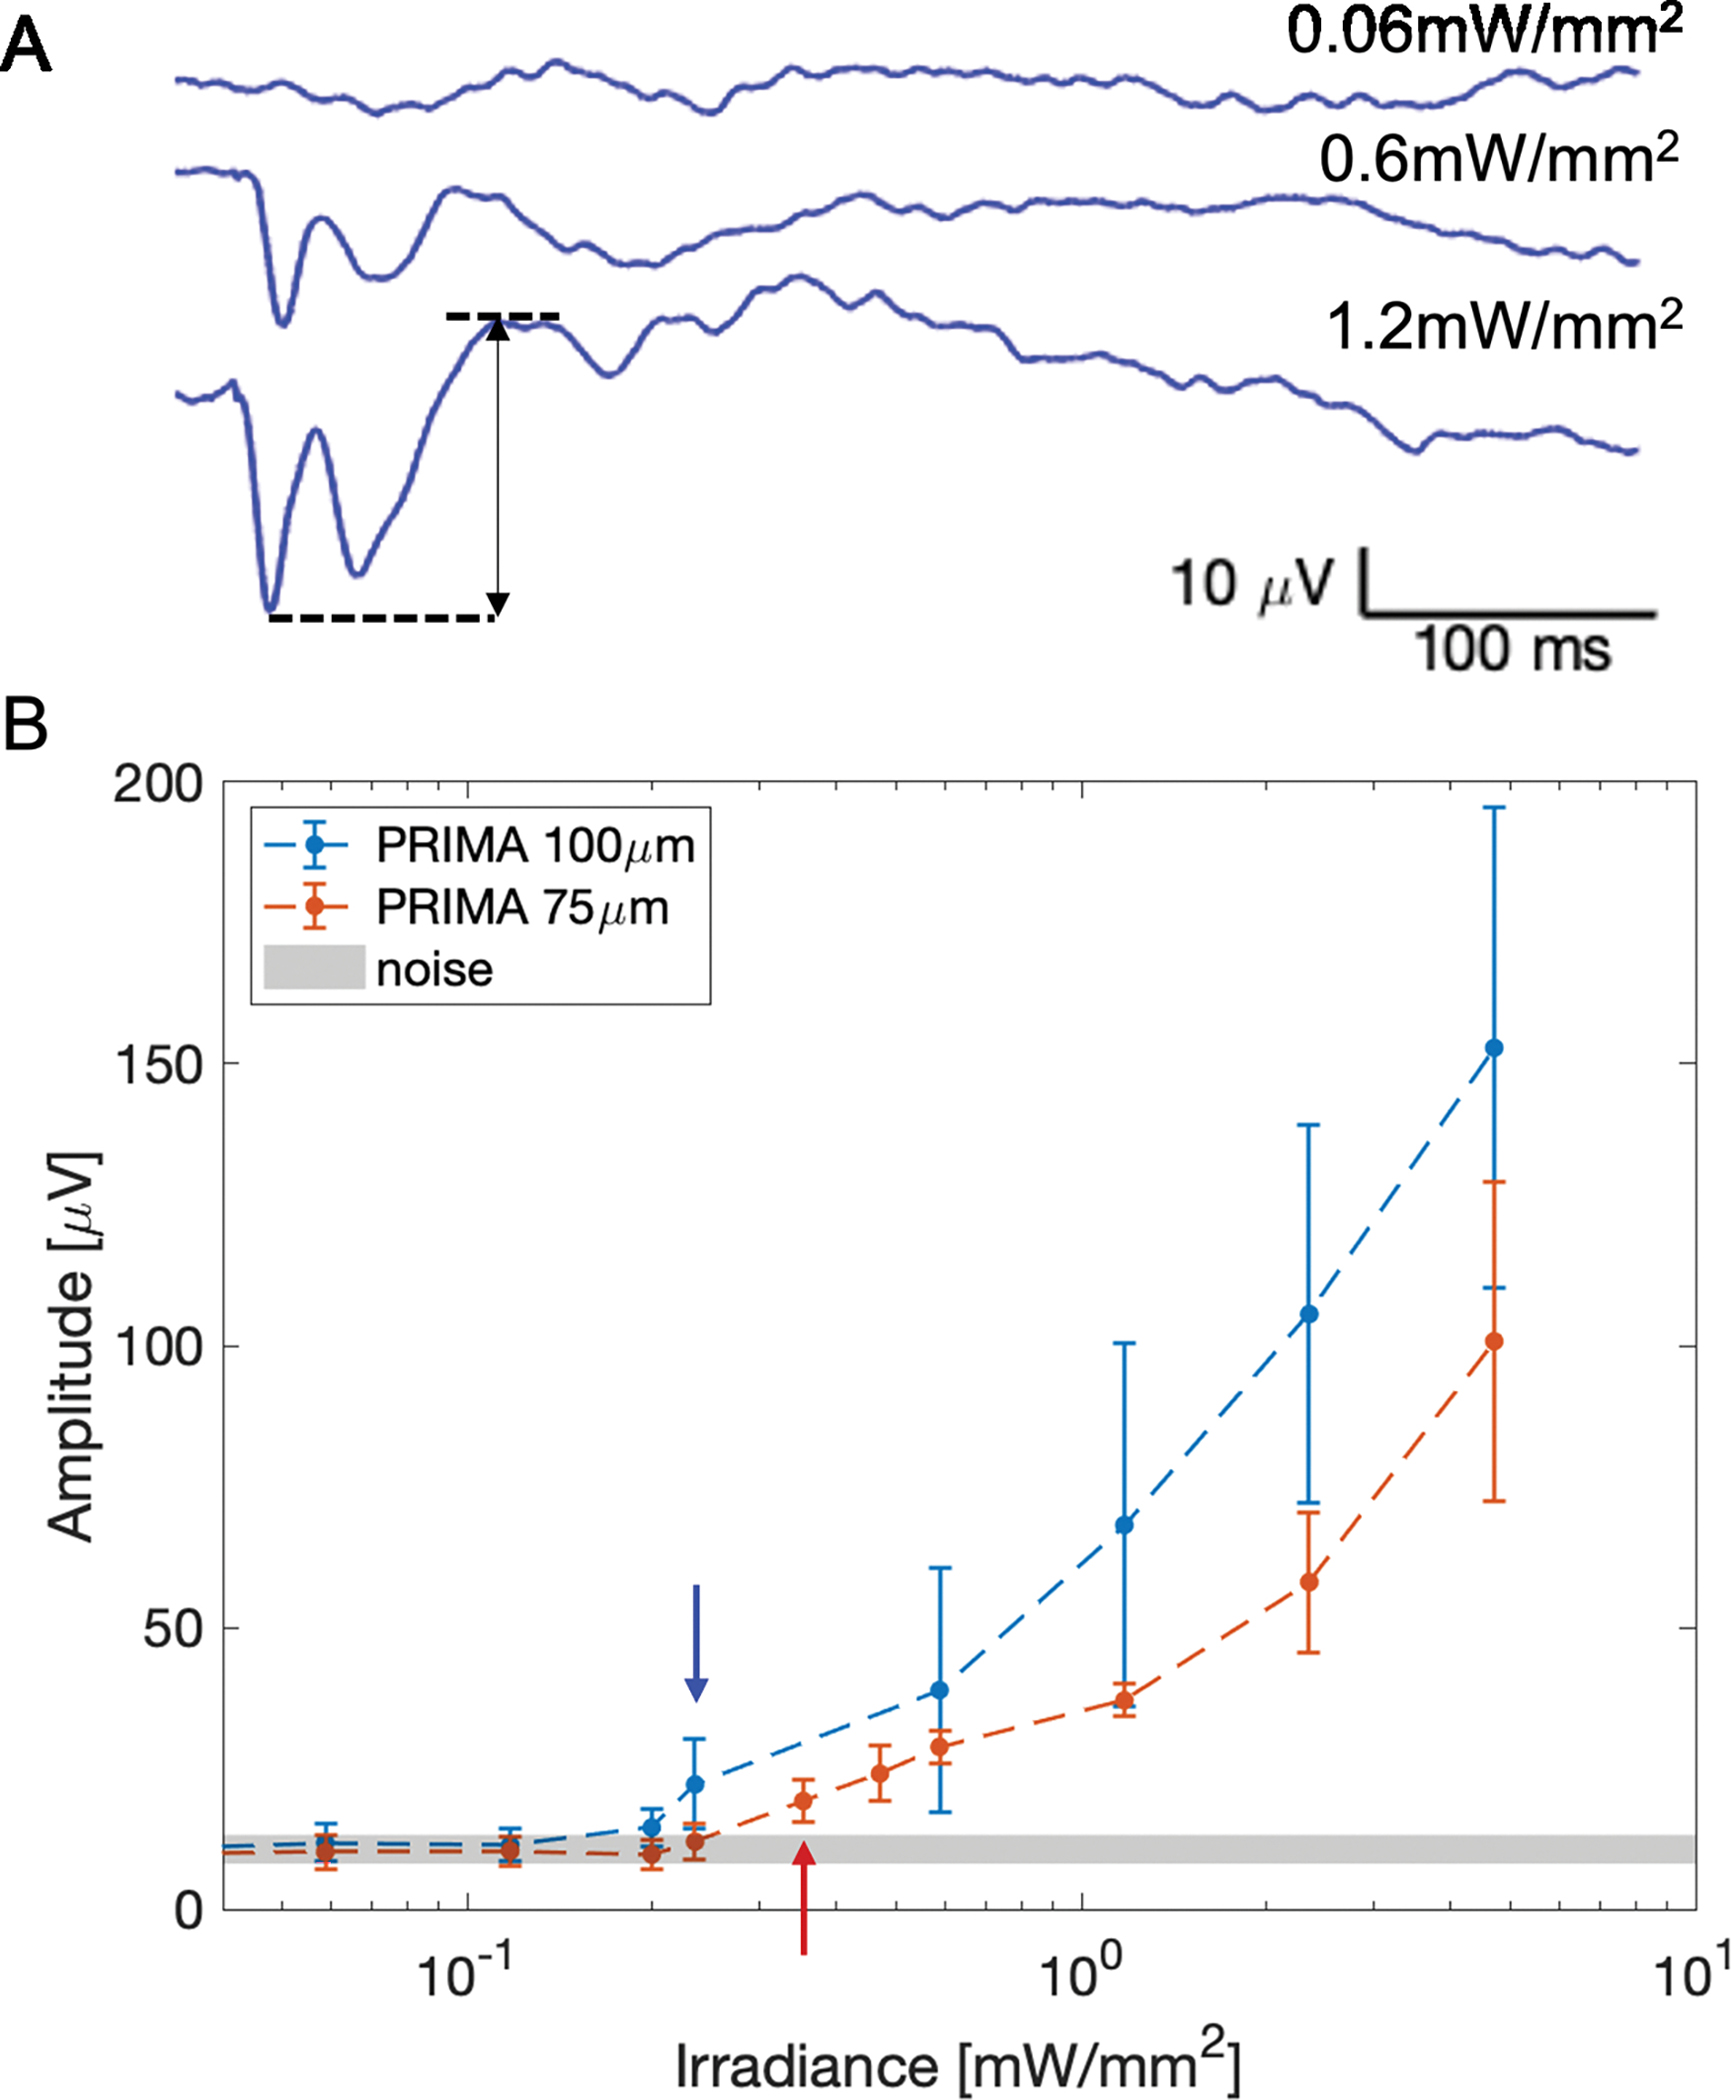
A) Example VEP waveforms measured in an RCS rat with a 75 μm implant. The top waveform, measured with no NIR stimulus, illustrates the noise, while the middle and bottom traces demonstrate above-threshold waveforms. The arrow indicates the amplitude of the bottom VEP waveform. B) The peak-to-peak VEP amplitude as a function of irradiance. The arrows point to the first irradiance level yielding an amplitude above the noise band for a given pixel size.