
Figure 5.
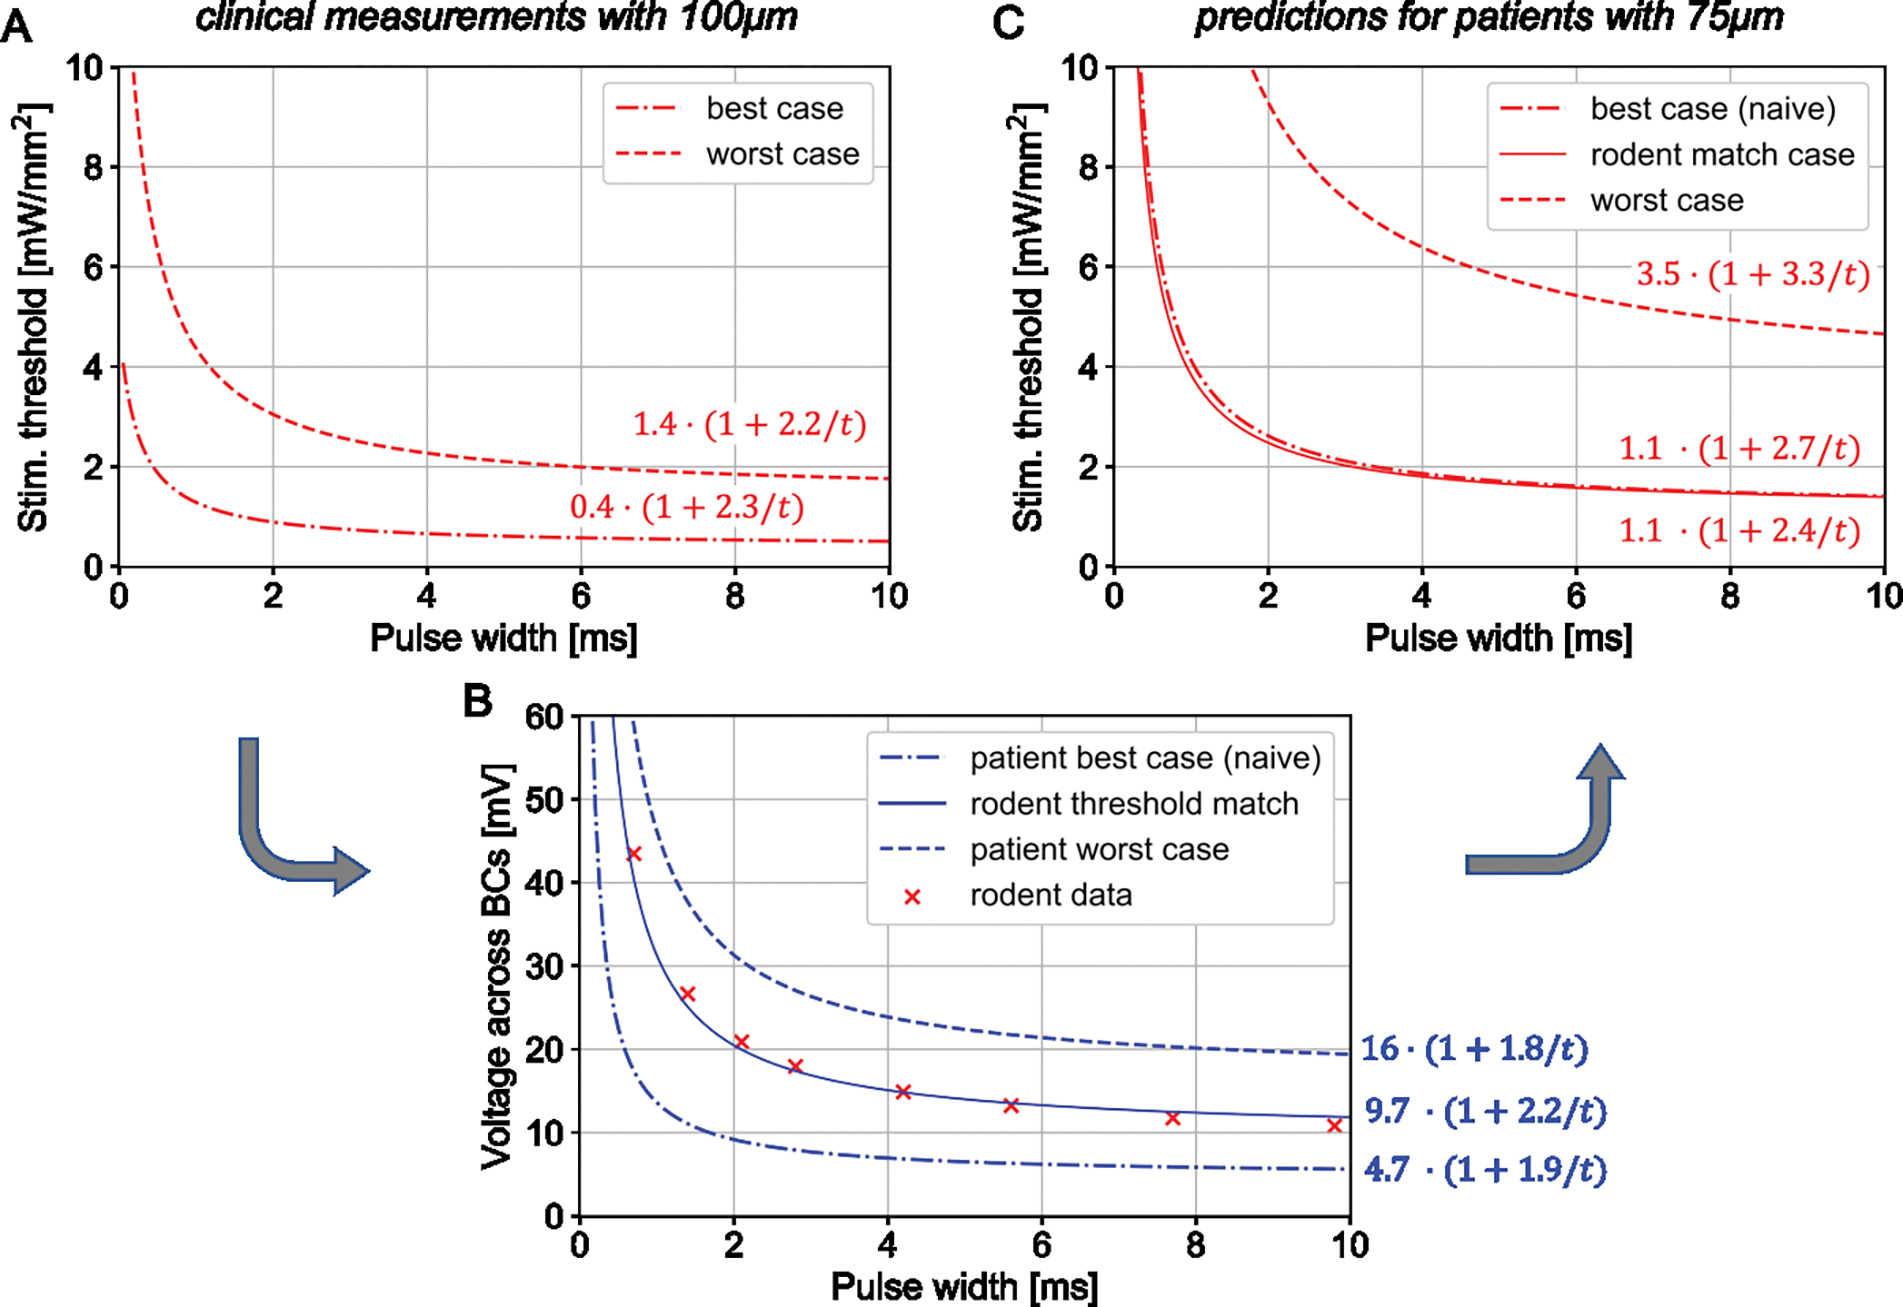
Strength-duration (S-D) relationships for human thresholds with 100 and 75 μm pixel arrays. A) Perceptual thresholds for the best and worst cases measured with 100 μm PRIMA implants. B) Stimulation thresholds in terms of a voltage drop across bipolar cells (BCs) for the best and the worst case, converted from A. The middle line represents the best-case thresholds with 100 μm implants adjusted to 20 μm separation between the BCs and the implant to match the rodent data (from Figure 4B). C) The predicted S-D curves for 75 μm pixels in all three cases, converted from voltage to irradiance.