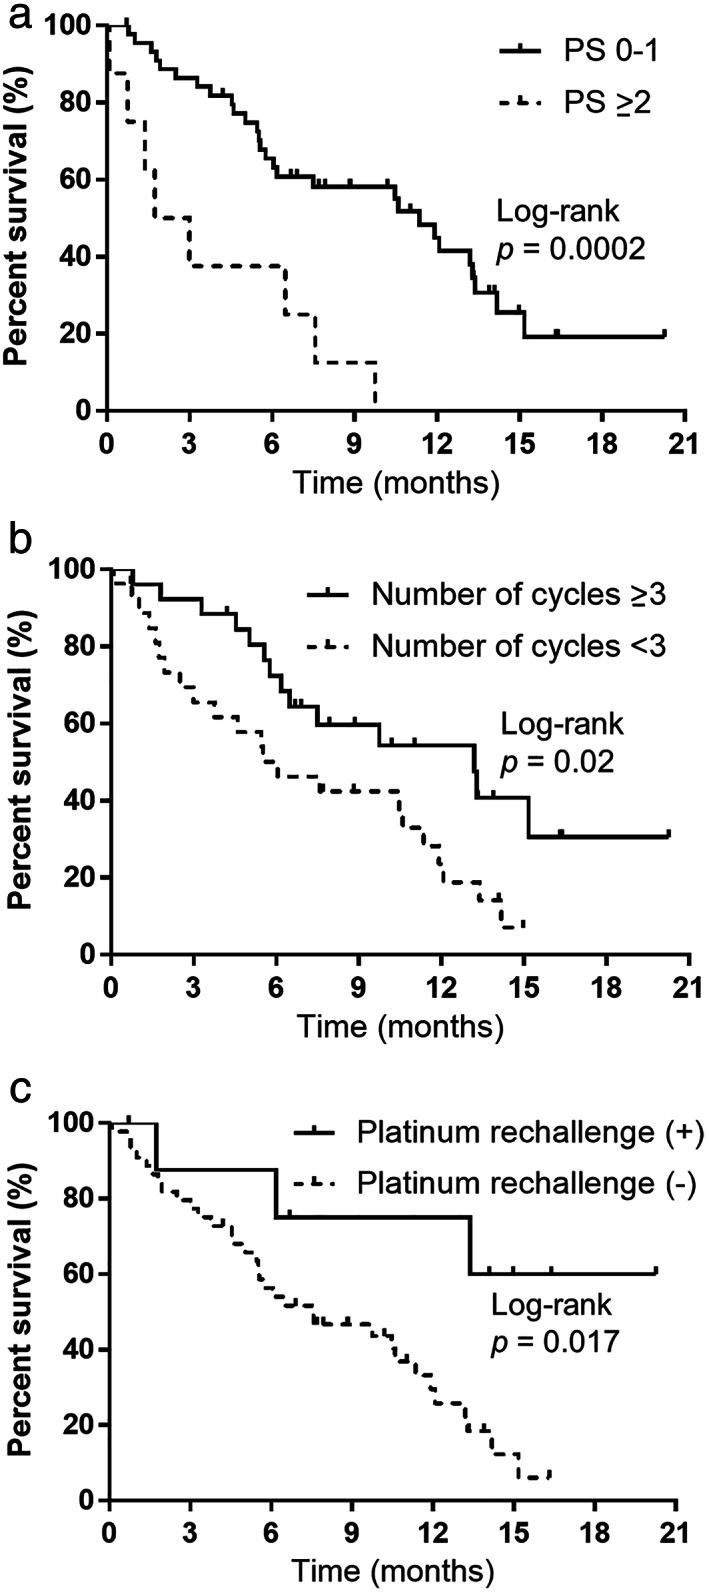
FIGURE 5.

(a) Kaplan–Meier curves of post‐progression survival (PPS), according to the performance status (PS) at relapse. PS 0–1, median = 11.3 months; PS ≥2, median = 2.3 months. (b) Kaplan–Meier curves of post‐progression survival (PPS), according to number of cycles of atezolizumab maintenance therapy. Number of cycles of atezolizumab maintenance therapy ≥3, median = 13.1 months; number of cycles of atezolizumab maintenance therapy <3, median = 5.4 months. (c) Kaplan–Meier curves of post‐progression survival (PPS), according to administration of platinum rechallenge chemotherapy. Platinum rechallenge chemotherapy, median = not reached; no platinum rechallenge chemotherapy, median = 6.0 months
