Fig. 6.
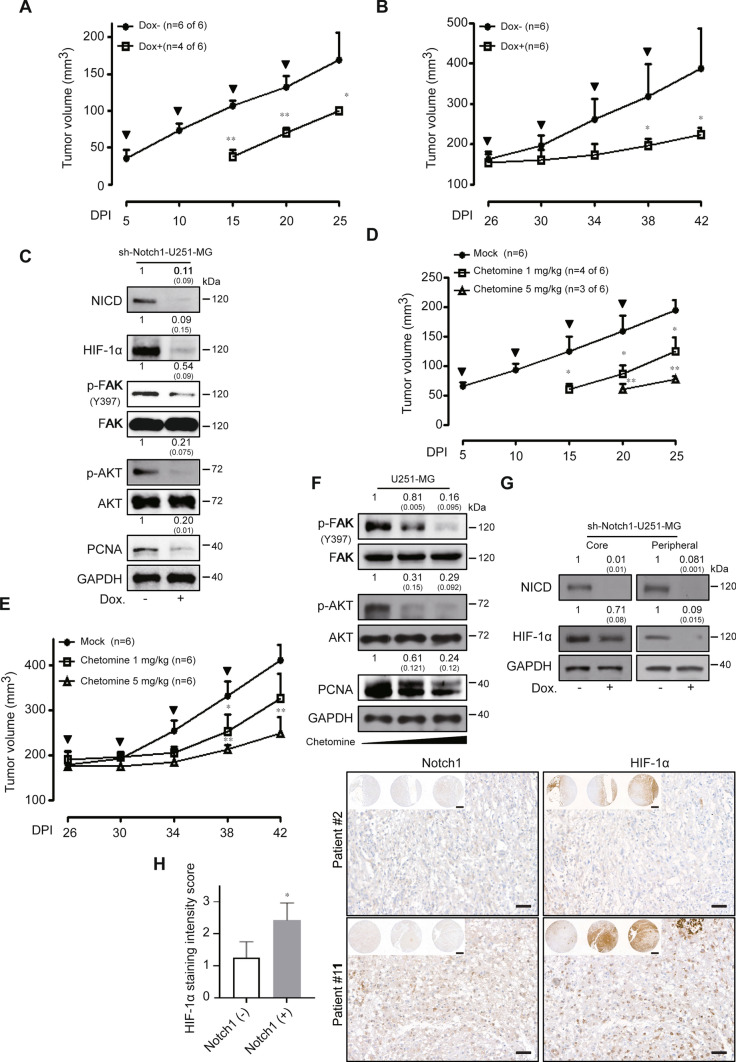
Blockade of abnormal HIF-1α induces in vivo anti-cancer effects in GBM cells. A, B sh-Notch1-Dox− (n = 6) and sh-Notch1-Dox+ (n = 6) U251-MG xenografted tumors were measured for 25 or 42 days. Bold arrows indicate the time of doxycycline treatment (Tukey’s post hoc test was used to detect significant differences in ANOVA, p < 0.0001; asterisks indicate a significant difference compared to sh-control and sh-Notch1, *p < 0.05, **p < 0.01, n.s. non-significant). C Western blot analysis of sh-Notch1-Dox− and sh-Notch1-Dox+ tumor lysates using anti-Notch1, HIF-1α, p-FAK, FAK, p-AKT, AKT, and PCNA antibodies. GAPDH was used as the loading control. Relative pixel intensities were measured using ImageJ software. The data are representative of three individual experiments. D, E The effects of chetomin (0, 1, or 5 mg/kg) on tumor size in U251-MG xenograft models were analyzed after 25 and 42 days. The bold arrows indicate the time of chetomin injection (Tukey’s post hoc test has been used to determine significant group effects in ANOVA, P < 0.0001; asterisks indicate a significant difference between the control group and chetomin injection group, *P < 0.05). F Western blot analysis of 0, 1, or 5 mg/kg chetomin injection tumor lysates using anti-p-FAK, FAK, p-AKT, AKT, and PCNA antibodies. GAPDH was used as the loading control. Relative pixel intensities were measured using ImageJ software. The data are representative of three individual experiments. G Regional lysates (peripheral or core region) from sh-Notch1-Dox− and sh-Notch1-Dox+ tumor samples were analyzed by immunoblotting for HIF-1α or NICD expression. GAPDH was used as the loading control. Relative pixel intensities were measured using ImageJ software. The data are representative of three individual experiments. Peripheral region refers to the outer 75% of the tumor sample sections. H Left, comparison of HIF-1α staining intensity scores between the Notch1-negative staining group (n = 4) and the Notch1-positive staining group (n = 7) among positively expressing HIF-1α patients. Right, representative images of GBM patient tissue microarray analysis (scale bar = 50 μm; inset image scale bar = 500 μm)

