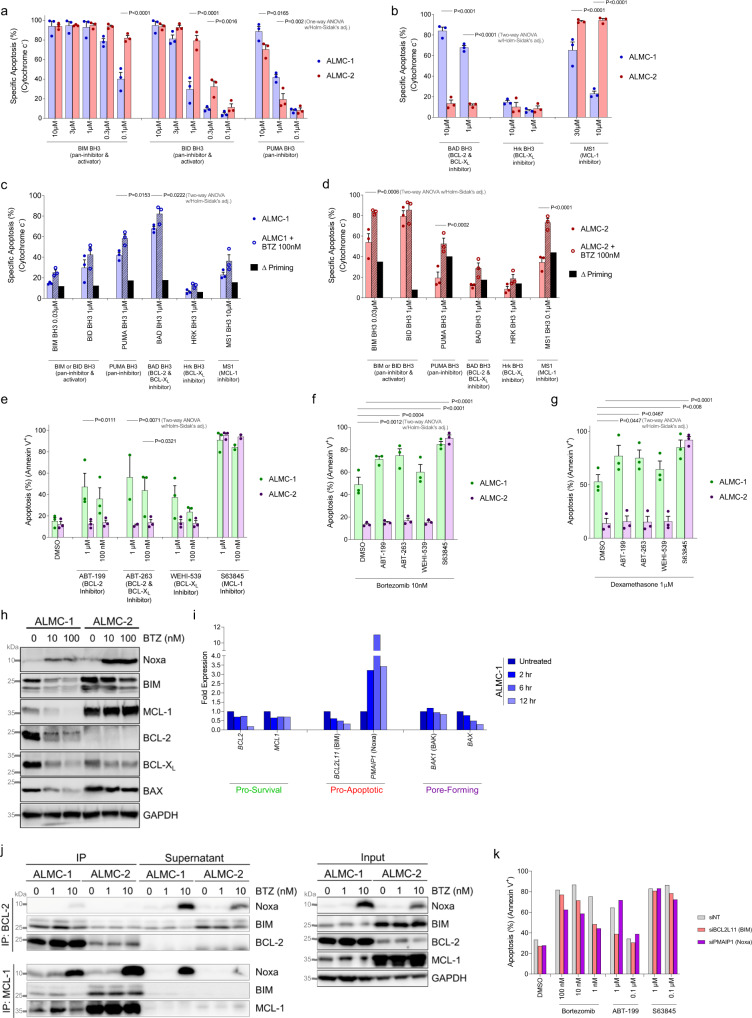
Fig. 4. AL amyloidosis cell line ALMC-1 is sensitive to BCL-2 and MCL-1 inhibition while multiple myeloma cell line ALMC-2 is sensitive only to MCL-1 inhibition.
a, b ALMC-1 and ALMC-2 cells were BH3 profiled with a activator or b sensitizer peptides at indicated concentrations (n = 3). c–d ALMC cell lines were BH3 profiled during short-term (4 h) treatment with bortezomib. Δ priming is calculated as the difference in treated versus untreated cells (n = 3). e–g ALMC cell lines were treated with indicated (e) single agents or f–g combinations for 12 h and apoptosis was detected by Annexin V staining (n = 3). a–g Data are presented as mean values + /- SEM. h Western blotting was performed on cell lines with and without 12 h treatment with bortezomib. i RT-qPCR validation of BCL-2 family gene expression in response to 10 nM bortezomib treatment, normalized to each gene’s untreated expression level (n = 3). j Immunoblot of BCL-2 and MCL-1 immunoprecipitation from ALMC-1 and ALMC-2 cells with and without 12 h bortezomib treatment. k In vitro sensitivity measured by Annexin V positivity of ALMC-1 cells treated for 12 h with indicated drugs, with BIM or Noxa knocked down by siRNA. P-values were calculated using one-way ANOVA with Holm-Sidak’s adjustment for a and two-way ANOVA with Holm–Sidak’s adjustment for b–g.

