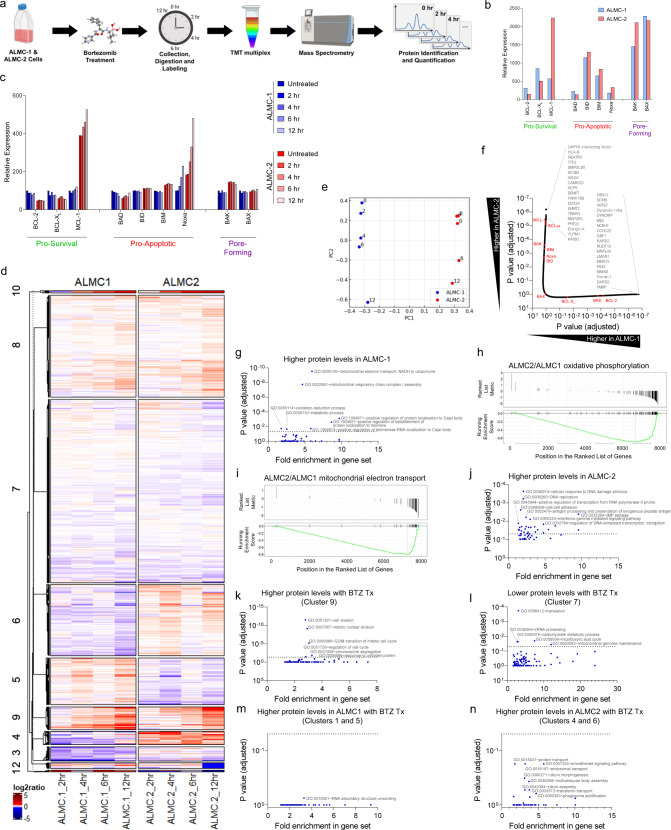
Fig. 6. Proteomic analysis of bortezomib-treated ALMC-1 and ALMC-2 cells.
a Overview of experiment and analysis to identify changes in protein expression associated with bortezomib treatment of AL cells. Created with BioRender.com. b Quantification of indicated BCL-2 family proteins. c Changes in BCL-2 family protein expression during bortezomib treatment. d Unbiased clustering analysis of proteins modulated by bortezomib treatment of ALMC-1 and ALMC-2 cell lines. Clustering was performed using the complete-linkage method based on Euclidean distance, and sub-clusters were separated by k means partitioning. e Principal component analysis of bortezomib-treated cells. f Ranking of all ~7900 quantified proteins with BCL-2 family proteins indicated in red. g Gene ontology (GO) biological processes (BP) that are associated with increased protein levels in ALMC-1 versus ALMC-2 cells. h–i Gene set enrichment analysis (GSEA) in ALMC-1 cells relative to ALMC-2 for proteins associated with h oxidative phosphorylation or i mitochondrial electron transport. j GO BP associated with increased protein levels in ALMC-2. k, l GO BP associated with k increasing or l decreasing protein levels during bortezomib treatment. m, n GO BP associated with increasing protein levels during bortezomib treatment specifically in ALMC-1 (m) or ALMC-2 (n) cells. P-values were calculated using linear regression and adjusted using Bonferroni correction for f, g, and j–n.

