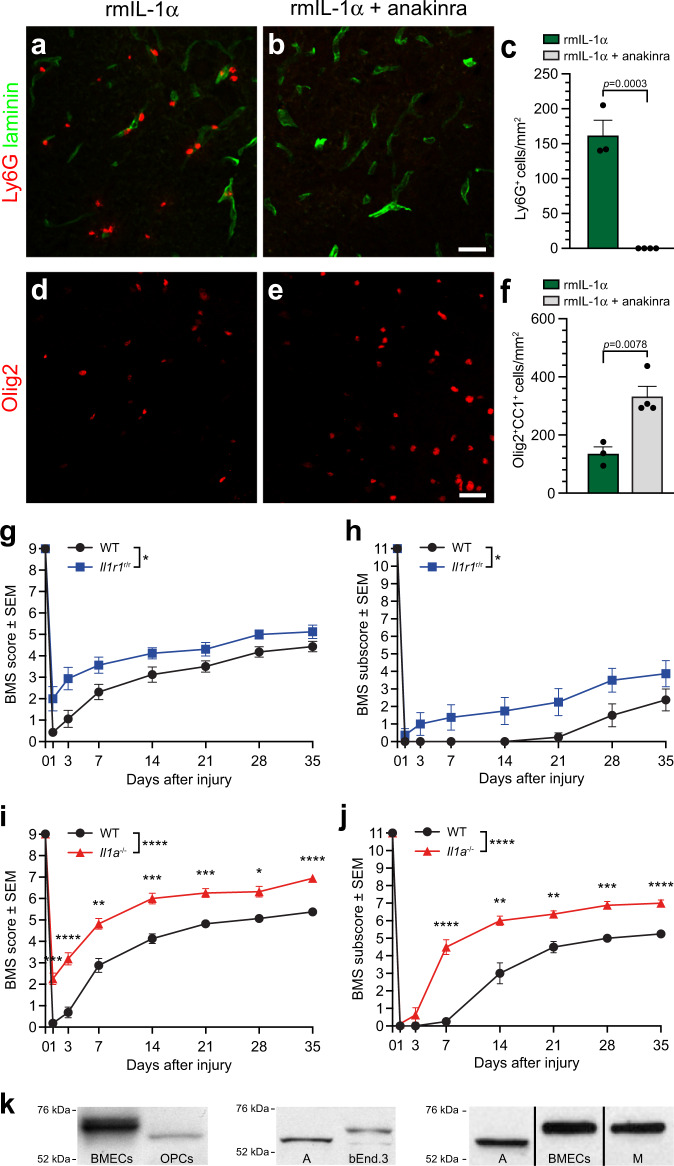
Fig. 4. IL-1α mediates its effects in both the inflamed and injured mouse spinal cord through IL-1R1.
a, b Representative confocal images showing the presence (or absence) of Ly6G+ neutrophils (red cells) in the spinal cord of C57BL/6 mice injected i.c.m. with either rmIL-1α alone (a) or rmIL-1α + anakinra, a recombinant human IL-1R antagonist (b). All mice were killed at 24 h post-injection. An anti-pan-laminin antibody was used to stain blood vessel basement membranes (green staining). c Quantification of the total number of Ly6G+ neutrophils that infiltrated the spinal cord of mice (n = 3–4 mice/group: n = 3 rmIL-1α, n = 4 rmIL-1α + anakinra). d, e Representative images showing immunostaining for the Olig2 transcription factor in the spinal cord of C57BL/6 mice injected with either rmIL-1α (d) or rmIL-1α + anakinra (e) and killed at 24 h. f Quantification of the total number of Olig2+ CC1+ mature oligodendrocytes in the spinal cord white matter at 24 h post-i.c.m. treatment (n = 3–4 mice/group: n = 3 rmIL-1α, n = 4 rmIL-1α + anakinra). g–j Locomotor function was assessed using the BMS score (g, i) and BMS subscore (h, j) over a 35-day period post-SCI in wild-type (WT), Il1r1r/r (Il1r1−/−) or Il1a−/− mice (n = 8 mice per group). k Detection by immunoblotting of IL-1R1 in various murine primary and immortalized cells including: Lane 1 = primary brain microvascular endothelial cells (BMECs), Lane 2 = primary oligodendrocyte progenitor cells (OPCs), Lane 3 = primary astrocytes (A), Lane 4 = immortalized bEnd.3 ECs (bEnd.3), Lane 5 = primary astrocytes (A), Lane 6 = primary BMECs, and Lane 7 = primary microglia (M). Data are presented as mean values + /− SEM and statistical significance was determined by either a two-tailed Student’s t-test (c, f) or a two-way repeated measures ANOVA followed by a Bonferroni post-hoc test (g–j). When not directly indicated in the graphs, p-values are as follows: ****p < 0.0001, ***p < 0.001, **p < 0.01, *p < 0.05, compared to the WT group. Scale bars: (a, b, in b) 25 µm, (d, e, in e) 25 µm.

