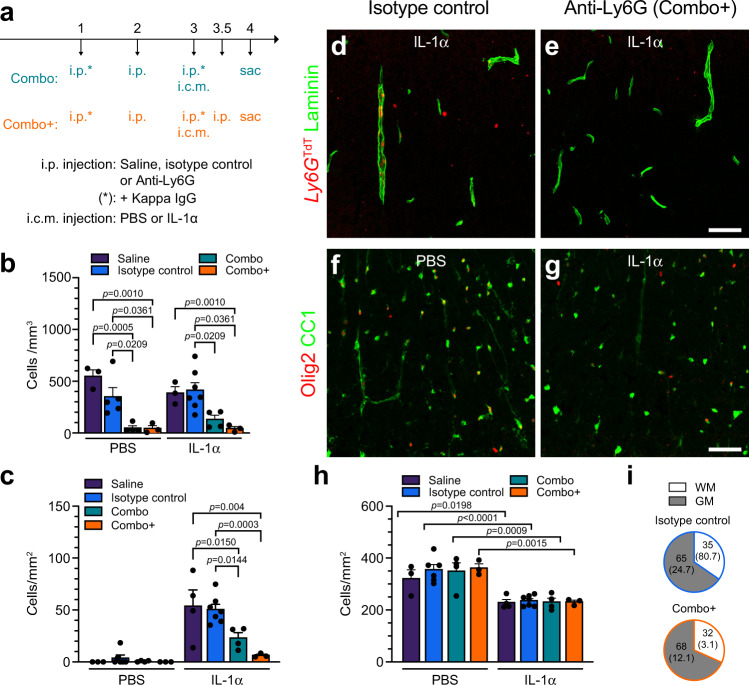
Fig. 9. Depletion of neutrophils does not alter IL-1α-mediated oligodendrocyte loss.
a Diagram showing the experimental design and timeline of the depletion study. Abbreviations: Combo, combination strategy; Combo+, adapted combination strategy; i.c.m., intra-cisterna magna; i.p., intraperitoneal; sac, sacrifice. b Quantification by flow cytometry of the number of Ly6GTdT+ neutrophils in the blood of PBS- and IL-1α-injected Ly6gCre-TdT::R26-TdT mice pretreated with either the Combo+ strategy, Combo strategy, isotype control antibodies or saline. Mice were killed at 24 h post-i.c.m. injection (n = 3 Saline + PBS, n = 5 Isotype control + PBS, n = 4 Combo + PBS, n = 3 Combo+ + PBS, n = 3 Saline + IL-1α, n = 7 Isotype control + IL-1α, n = 4 Combo + IL-1α, n = 3 Combo+ + IL-1α). c Quantification of Ly6GTdT+ neutrophils that infiltrated the spinal cord at 24 h post-i.c.m. injection (n = 3 Saline + PBS, n = 6 Isotype control + PBS, n = 4 Combo + PBS, n = 3 Combo+ + PBS, n = 4 Saline + IL-1α, n = 7 Isotype control + IL-1α, n = 4 Combo + IL-1α, n = 3 Combo+ + IL-1α). d, e Confocal images showing Ly6GTdT+ cells (red) and laminin (green) in the spinal cord of Ly6gCre-TdT::R26-TdT mice injected i.c.m. with rmIL-1α, and pretreated i.p. with either isotype control antibodies (d) or the Combo+ treatment (e). f, g Confocal immunofluorescence imaging of Olig2 and CC1 in the spinal cord white matter of Ly6gCre-TdT::R26-TdT mice injected i.c.m. with either IL-1α or PBS, and treated with either isotype control antibodies (f) or the Combo+ strategy (g). h Quantification of Olig2+ CC1+ mature OLs in the spinal cord white matter of mice (n = 3 Saline + PBS, n = 6 Isotype control + PBS, n = 4 Combo + PBS, n = 3 Combo+ + PBS, n = 4 Saline + IL-1α, n = 7 Isotype control + IL-1α, n = 4 Combo + IL-1α, n = 3 Combo+ + IL-1α). i Percentage and total number (in parentheses) of Ly6GTdT+ neutrophils in the spinal cord gray matter (GM) versus white matter (WM). All data are mean values + /− SEM and statistical significance was determined by a two-way ANOVA followed by Bonferroni post-hoc test (b, c, h). Pairwise comparisons and p-values are indicated in graphs. Scale bars: (d, e, in e) 50 µm, (f, g, in g) 50 µm.

