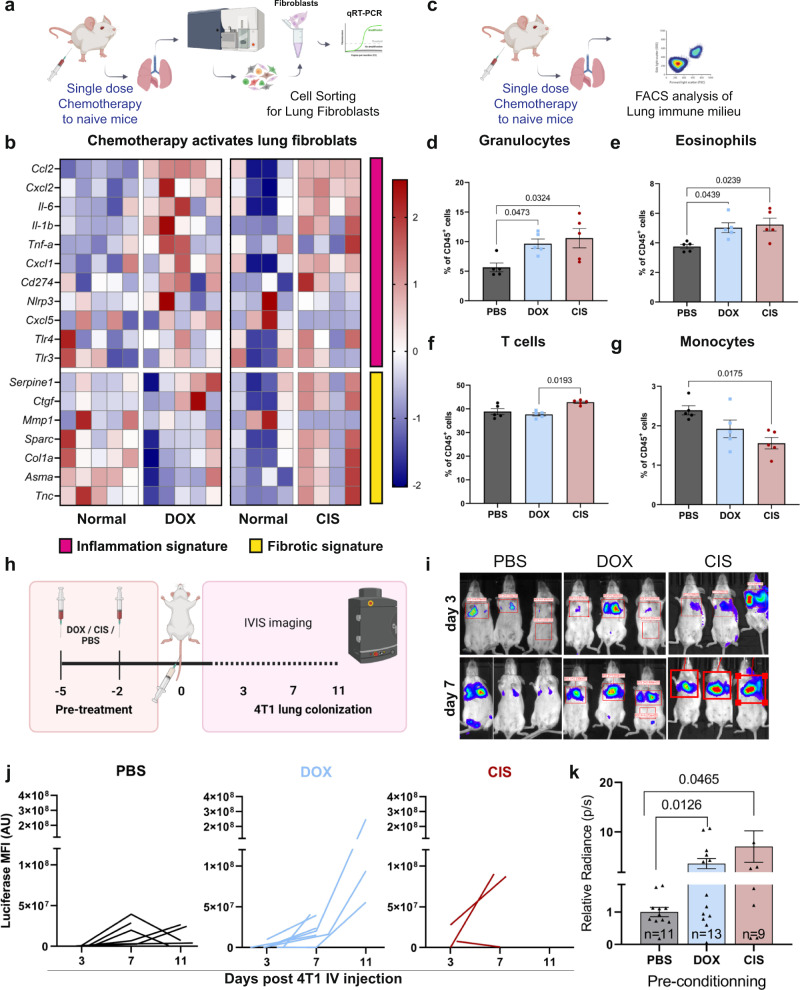
Fig. 1. Cytotoxic treatments induce alterations in the stromal and immune landscapes and enhance breast cancer cell colonization in lungs.
a Gene expression analysis of sorted lung fibroblast (PDGFRα+) following chemotherapy. One dose of doxorubicin (DOX, 5 mg/kg), cisplatin (CIS, 5 mg/kg), or saline (PBS) was administered to naive BALB/c mice by intraperitoneal (i.p) injection. n = 5 (Dox), n = 4 (CIS). b Heatmap of inflammatory and fibrosis-related gene expression. c Flow cytometry analysis of major immune cell populations at lungs following one dose treatment with chemotherapy. Flow cytometry analysis of: d granulocytes (Ly6G+Ly6Cint), e eosinophils (Ly6G-SiglecF+), f T cells (CD3+), g monocytes (Ly6G-Ly6C+). n = 5 mice per group. Data presented are mean percentage of CD45+ cells ± s.e.m; P-values were calculated using one-way ANOVA test. h Lung colonization assay. Naive BALB/c mice were pre-treated with two injections of chemotherapy or PBS as control, and 48 h later 2*105 4T1-luciferase cells (4T1-luc) were injected intravenously (IV) and early lung colonization was monitored using IVIS imaging. i Representative IVIS imaging, 3 and 7 days post-inoculation. j Kinetics of 4T1 lung metastatic growth represented by luciferase bioluminescence intensity following 4T1-luc IV injection. k Quantitative analysis of data shown in (i, j) at day 7. n = 11, 13, and 9 in PBS, DOX, and CIS groups, respectively. Data from two independent experiments are presented as mean ± s.e.m, normalized to PBS group; P-values were calculated using one-tailed Welch’s t-test. Graphical summary was designed using BioRender. Source data are provided as a Source Data file.

