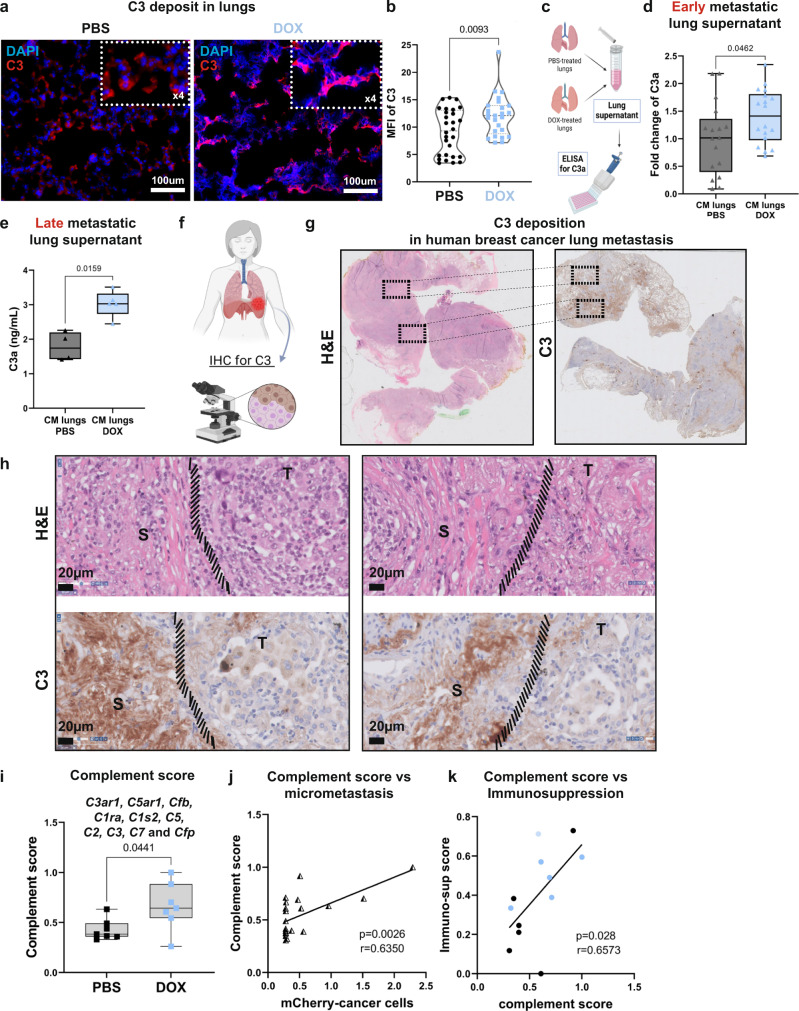
Fig. 6. Activation of complement signaling in lungs is associated with infiltration of C3aR and C5aR1 expressing MDSCs.
a Representative images of C3 staining in lungs of doxorubicin-treated mice or vehicle-treated mice at early metastatic stage. n = 3 mice per group; Scale bars, 100 µm. Top right rectangle shows 4-fold magnification. Cell nuclei-DAPI; C3-Rhodamine Red. b Quantification of MFI of C3 in staining shown in (a), a minimum of 5 fields of view per lung were assessed in n = 3 mice per group. P-values were calculated using Welch’s t-test. c ELISA of C3a levels in lung. C3a ELISA at early metastatic stage n = 17 and 18 for PBS and DOX respectively (d), or late metastatic stage n = 4 and 5 for PBS and DOX respectively (e). d, e Bars represent range of data points, line represents mean. P-values were calculated using Welch’s t-test. f Lung tissue sections from patients with breast cancer lung metastases were analyzed by IHC. Representative images of H&E staining (g) and C3 staining (h). S = stroma rich area, T = tumor cell-rich area; n = 5 breast cancer patients. Scale bars, 20 μm. i Complement score of total-lung mRNA. n = 7 in both groups; Bars represent range of data points, line represents mean. P-values were calculated using two-tailed Mann–Whitney test. j Correlation between complement score and micro-metastasis, quantified by mCherry mRNA expression. r = 0,635; p < 0,0026. k Correlation between complement score and immunosuppression score. r = 0,6573; p < 0,03. For j, k two-tailed Pearson correlation was calculated. Graphical summary was designed using BioRender. Source data are provided as a Source Data file.

