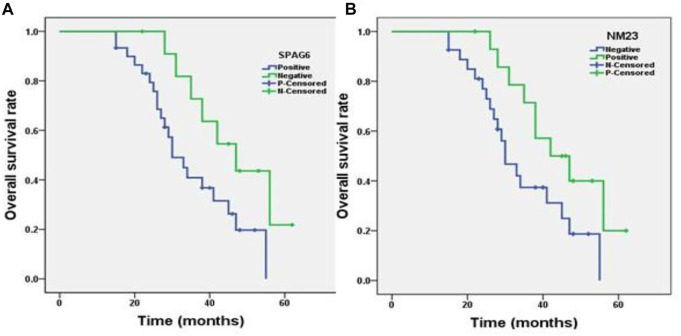
FIGURE 3.
Kaplan−Meier survival analysis of patients with osteosarcoma (n = 42). (A) Correlation of the SPAG6 protein expression level with the overall survival time of patients with osteosarcoma. The y-axis represents the percentage of patients, the x-axis represents their survival in months, and the green line represents SPAG6+ patients with a worse survival trend than the blue line representing SPAG6- (p < 0.05). (B) Correlation of the NM23 protein expression level with the overall survival time of patients with osteosarcoma, and the green line represents NM23+ patients with a better survival trend than the blue line representing NM23- patients (p < 0.05).

