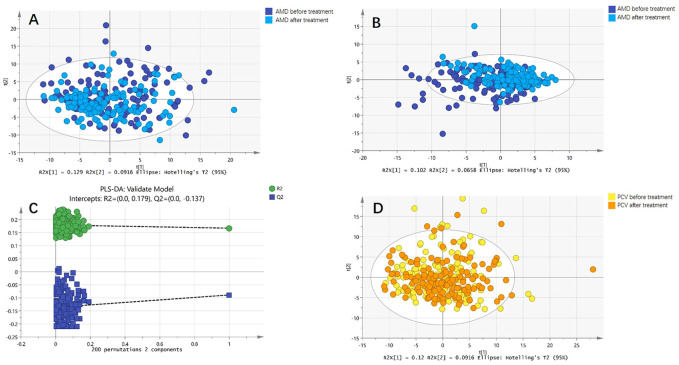
FIGURE 2.
Comparison of metabolic profiles before and after anti-VEGF treatment. (A) Principal component analysis (PCA) model of patients with nAMD before and after anti-VEGF treatment. The PCA model showed no difference. (B) Partial least squares discriminant analysis (PLS-DA) model of patients with nAMD before and after anti-VEGF treatment. The PLS-DA model also showed no difference. (C) The permutation test indicated that PLS-DA model of nAMD overfitted. (D) PCA model of patients with PCV before and after anti-VEGF treatment. The PCA model showed no difference.

