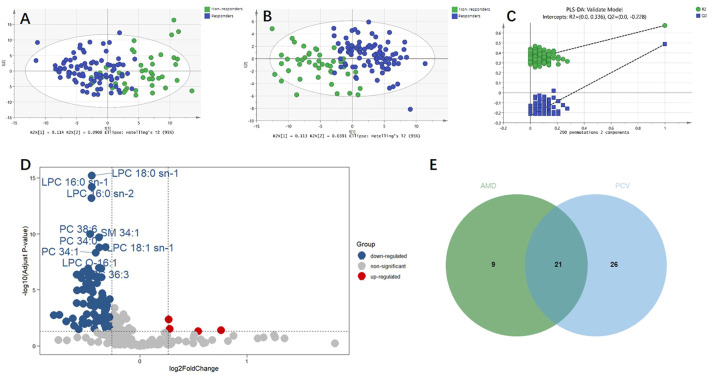
FIGURE 3.
Metabolic differences between responders and non-responders to anti-VEGF treatment combining nAMD and PCV. (A) Principal component analysis (PCA) model showed significant difference. (B) Partial least squares discriminant analysis (PLS-DA) model showed significant difference. (C) The permutation test demonstrated that PLS-DA model did not overfit. (D) Volcano plot of the differential metabolites between responders and non-responders. Blue and red dots indicated down-regulated and up-regulated metabolites, respectively. (E) Venn plot of the differential metabolites between responders and non-responders in AMD (30 metabolites) and the differential metabolites between responders and non-responders in PCV (47 metabolites).

