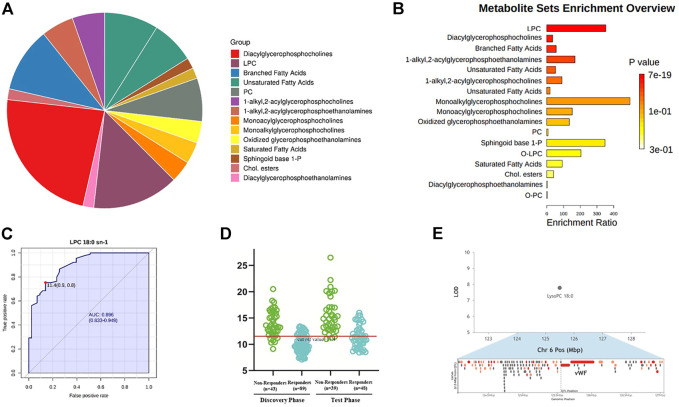
FIGURE 5.
Enriched metabolite pathways and potential biomarker associated with different response to anti-VEGF treatment. (A) Interactive pie chart of sub-classes of differential metabolites. (B) Bar plot of enriched metabolite pathways. Responders and non-responders differed most significantly in metabolism of LPC (p = 7.16 x 10^-19) and diacylglycerophosphocholine (p = 6.96 x 10^-17). (C) Diagnostic outcome of LPC 18:0 in the discovery group. The area under curve is 0.896 with 95% confidence internal between 0.833 and 0.949, to discriminate responders from non-responders. The optimal cut-off value of LPC 18:0 was 11.4. (D) Prediction accuracies by LPC 18:0 in the discovery and validation group. This cut-off value 11.4 was used to predict treatment response in the validation group. The predictive value was 72.4%. (E) Hotspot mapping to chromosome 6: 125.554 Mbp indicated the gene associated with LPC 18:0 (highlighted in red). The single nucleotide polymorphism of von Willebrand Factor was highly relevant with the level of LPC 18:0.

