FIGURE 1.
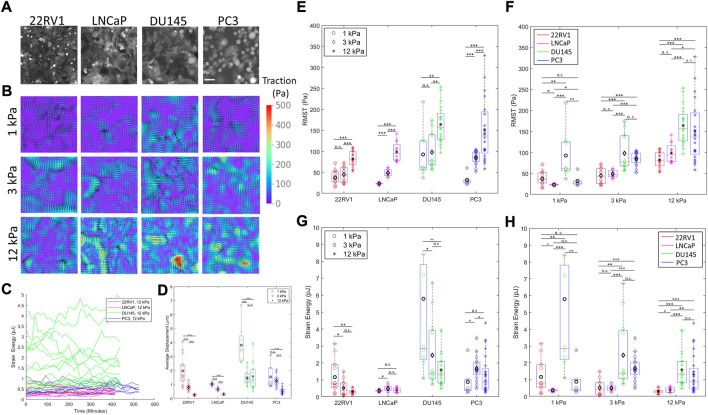
Prostate cancer cells with varying metastatic potential display unique substrate stiffness-dependent monolayer contractility. (A) Representative prostate cancer (PCa) monolayers of increasing metastatic potential (22RV1, LNCaP, DU145, and PC3) on 3 kPa substrates labelled with CellTracker Orange CMTR cell dye. (B) Representative traction maps generated by monolayers of increasing metastatic potential on substrates of increasing stiffness. (C) Representative time traces of measured contractile metrics (here strain energy) for individual monolayers. (D) Time-averaged surface displacement exerted by the cell monolayer to its underlying substrate, as measured using a traction force microscopy cross-correlation algorithm. Average displacement measurements converged to similar values approaching the noise level on 50 kPa substrates, suggesting that the 50 kPa substrate is too stiff to resolve cell deformations, restricting our analysis to contractility on 1–12 kPa. (E–F) Root mean-squared traction (RMST) stress of PCa cell lines cultured on substrates of various substrate stiffnesses, grouped according to cell type (E) and stiffness (F). (G–H) Strain energy of PCa cell lines cultured on substrates of various substrate stiffnesses, grouped according to cell type (G) and stiffness (H). Scale bar in (A) is 50 μm. Black markers on (D–H) indicate the mean values. Statistics were calculated using a pairwise Mann–Whitney U test where *p < 0.1; **p < 0.01; ***p < 0.001. Pairwise statistical comparisons across all groups for average displacement, RMST, and strain energy may be found in Supplementary Tables S2, S3, and S4, respectively.

