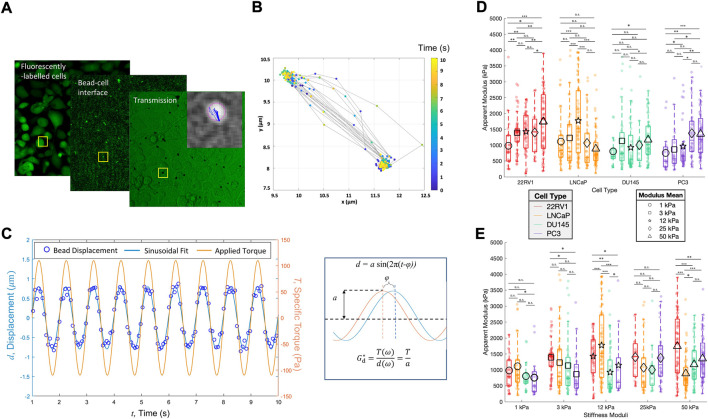
FIGURE 2.
Prostate cancer cell monolayers of varying metastatic potential display diverse cell stiffness. (A) Parallelized acquisition of membrane-bound 4.5 um RGD-coated magnetic beads displaced by an oscillating applied torque. The sample shown is PC3 plated on 3 kPa. (B) Trajectories of individual beads tracked and synchronized with the applied torque, after which (C) bead displacements were fitted to a sinusoid curve to determine the apparent cell modulus, G d *. (D) Apparent modulus measured for cell lines of increasing metastatic potential on substrates of increasing stiffness, grouped according to cell type. (E) Same data shown in A but clustered according to the substrate type. Statistics were calculated using a pairwise Mann–Whitney U test where *p < 0.1; **p < 0.01; ***p < 0.001. Pairwise statistical comparisons across all groups for apparent cell moduli may be found in Supplementary Table S5.

