FIGURE 3.
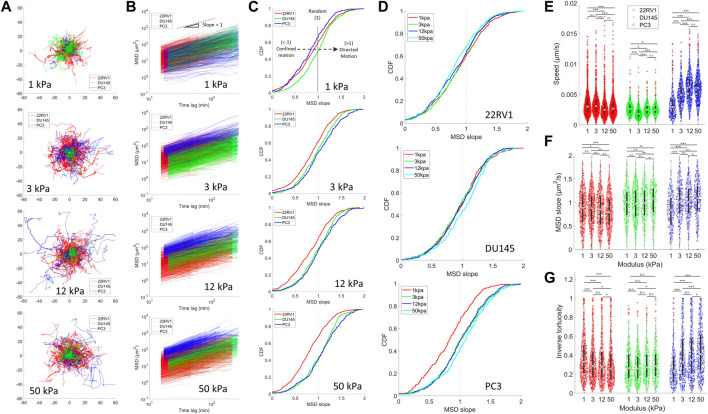
Motility is differentially affected by substrate stiffness for PCa monolayers of varying metastatic potential. Cell motility within a monolayer was measured for PCa cell lines plated on different substrate stiffnesses by tracking fluorescently labelled nuclei. (A) Trajectories of PCa cell nuclei on different stiffnesses. (B) Mean squared displacements (MSD) as a function of time lag. The black dotted line indicates an MSD slope of one. (C) Cumulative probability density functions (CDF) of MSD of slopes calculated from the MSD-time-lag curves for all cell lines on each stiffness (Top–down: 1, 3, 12, and 50 kPa). MSD slopes indicate the nature of cell motion, where slope >1 indicates directed motion, ∼1 indicates random motion, <1 indicates caged or constrained motion, and 0 indicates no motion. Rightward shifting of the CDF curves past a value of 1 indicates a larger proportion of cells undergoing directed motion, as indicated by the black dashed arrow in the top panel. (D) CDF with the same data as shown in (C) but grouped according to cell type to display stiffness-dependent changes. (E) Average cell speed, (F) MSD slopes, and (G) inverse tortuosity of cells plated on various substrate stiffness as determined by tracking cell nuclei. Inverse tortuosity indicates the persistence of a given cell trajectory, where 1 indicates a completely straight trajectory, and approaching zero is an infinitely curved trajectory. We were unable to establish an H2B-mTurq expressing cell line model in LNCaP, and thus they are not included in these figures. Statistics were calculated using a pairwise Mann–Whitney U test where *p < 0.1; **p < 0.01; ***p < 0.001. Pairwise statistical comparisons across all groups for average speed, MSD slopes, and inverse tortuosity may be found in Supplementary Tables S6, S7, and S8, respectively.

