FIGURE 3.
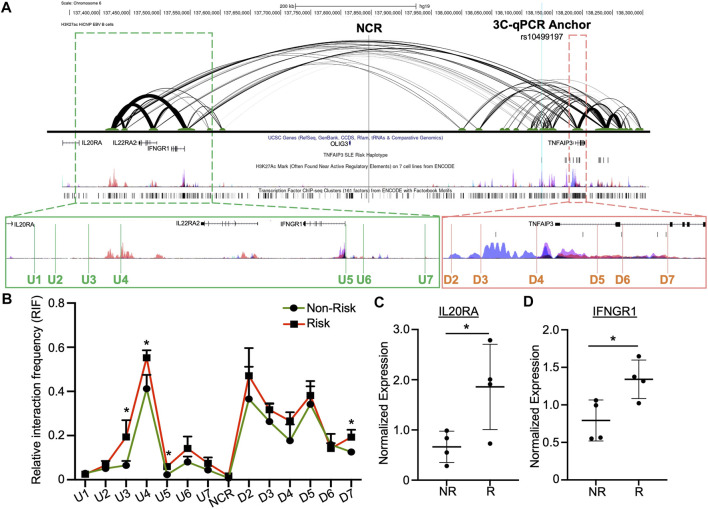
Enhancer upstream of TNFAIP3 influences distant gene expression through allele-specific chromatin-chromatin looping. (A) H3K27ac HiChIP looping interactions within the TNFAIP3 locus visualized as a two-dimensional diagram. Arc thickness is proportional to the frequency of paired-end tags (6 PET threshold). H3K27ac Peak Track was adapted from the UCSC Genome Browser ENCODE H3K27ac Chromatin marks for GM12878 and six other cell lines. Zoomed outsets depict 3C-qPCR primer locations (green, upstream loop anchors; orange, loop anchors spanning the TNFAIP3 gene body). (B) 3C-qPCR was performed in EBV B cells homozygous for the SLE TNFAIP3 non-risk or risk haplotype using anchor primers shown in (A). Relative interaction frequency was calculated by normalizing the interaction frequencies to the interaction frequency of the random ligation control and plotted as mean ± SEM, n = 3; Student’s t-test, *p < 0.05. Interactions were considered positive if the relative interaction frequency was greater than the interactions between the anchor and the negative control region of the locus ligation control. (C,D) Expression of IL20RA (C) and IFNGR1 (D) was measured in EBV B cell lines carrying the non-risk or risk SLE haplotype using qRT-PCR. Expression was normalized to GAPDH; Student’s t-test, n > 4; *p < 0.05. (Figure Abbreviations: NR, TNFAIP3 non-risk haplotype; R, TNFAIP3 risk haplotype; RIF, relative interaction frequency; RLC, random ligation control; NCR, negative control region).

