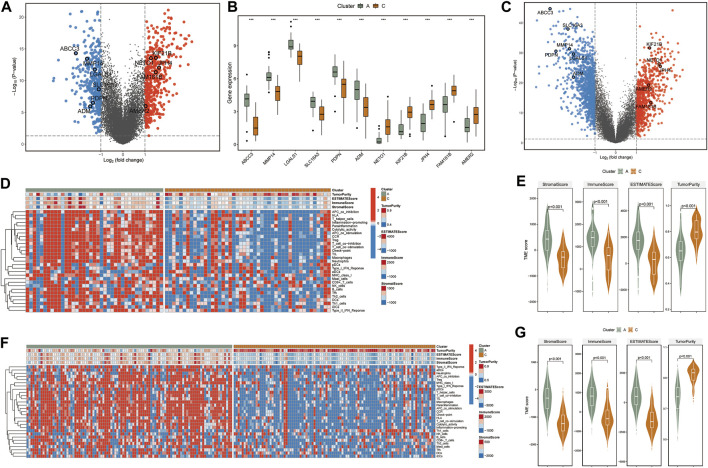
FIGURE 2.
(A) The volcano plot shows fold changes for genes differentially expressed between TCGA-clusters A and C. The differentially expressed PCGI methylation-driven genes are highlighted in the figure. (B) Boxplots of differentially expressed PCGI methylation-driven genes between clusters A and C. (C) The volcano plot shows fold changes for genes differentially expressed between CGGA-clusters A and C. The differentially expressed PCGI methylation-driven genes are highlighted in the figure. (D) Heatmap and hierarchical clustering of normalized immune cell infiltration score of TCGA samples. (E) Violin plots for the distributions of StromalScore, immuneScore, ESTIMATEScore, and TumorRurity of TCGA samples. (F) Heatmap and hierarchical clustering of normalized immune cell infiltration score of CGGA samples. (G) Violin plots for the distributions of StromalScore, immuneScore, ESTIMATEScore, and TumorRurity of CGGA samples.

