FIGURE 5.
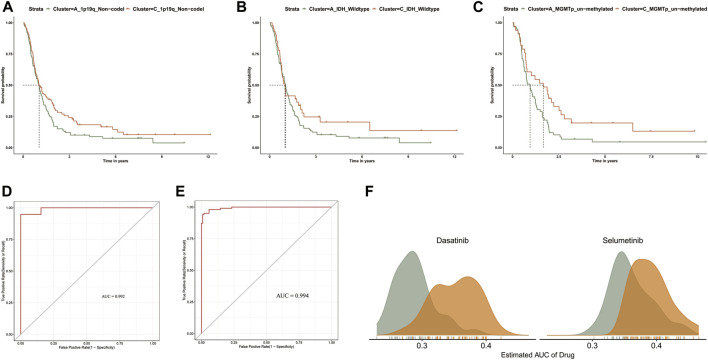
(A–C) Kaplan-Meier survival curve analysis between clusters A and C in 1p/19q_Non-codel, MGMTp_un-methylated, and IDH_wildtype). (D) The ROC curves of TCGA sample prediction results. (E) The ROC curves of CGGA sample prediction results. (F) Comparison of estimated Dasatinib and Selumetinib sensitivity.

