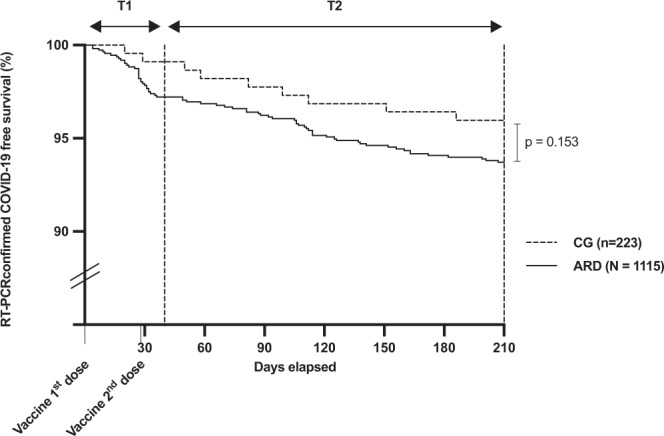
Fig. 2. Kaplan–Meier curves of COVID-19 incident cases.

The figure depicts real-time polymerase chain reaction (RT-PCR) confirmed COVID-19 cases in patients with autoimmune rheumatic disease (ARD) and controls (CG). All participants were followed from the day of inclusion, which is the day of first dose vaccination with CoronaVac vaccine (DO) up to 10 days after the second dose vaccination (T1). The second period of follow-up (T2) ranged from T1 to 6 months after the second dose. Kaplan–Meier curves were compared with long-rank test and if p-value was <0.05 then the difference was considered significant.
