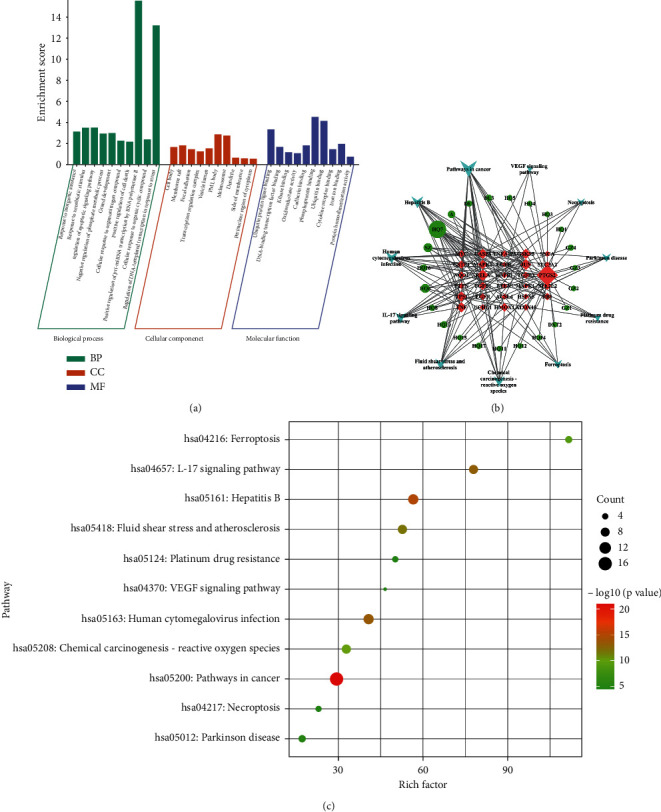
Figure 3.

(a) The BP, CC and MF enrichment score in GO enrichment analysis of ZL capsule. (b) The ZL capsule active ingredients- ICH key targets- Top 11 pathway network diagram. Different shapes represent different nodes. The circle is the active ingredients, the inverted triangle is the top 11 pathway, and the diamond is the gene target. The node size represents its degree value. The larger the size, the more important the node is. (c) The bubble diagram of top 11 pathway in KEGG enrichment of ZL capsule. The size and color of circulars represent the importance of related pathway. The larger the circular size and the redder the color, the more important the pathway is.
