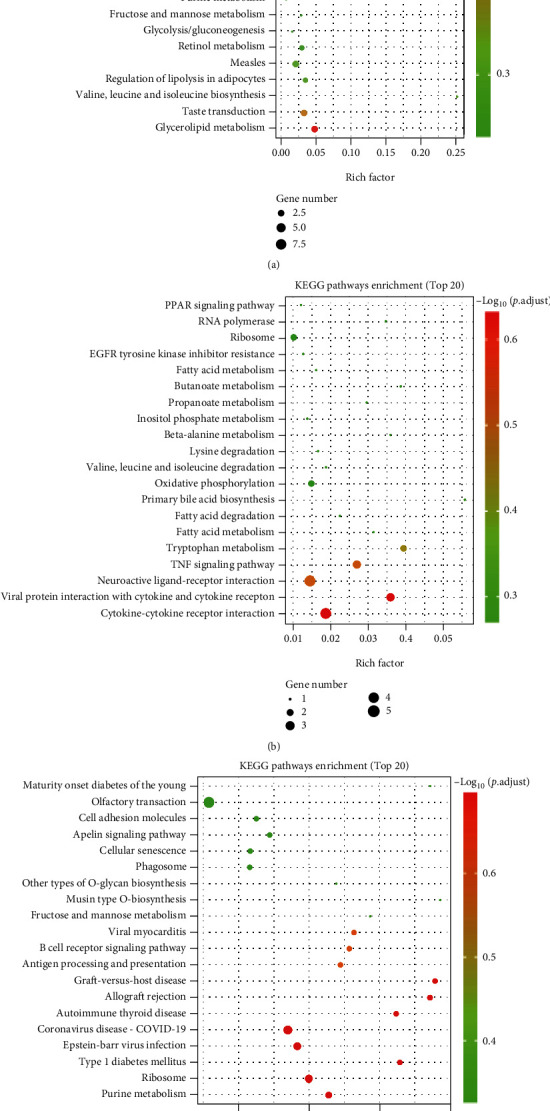
Figure 8.

KEGG pathway analyses of DEGs identified by comparing before and after exposure to EMP or H2 treatment. The vertical coordinate indicates the name of the pathway, and the horizontal coordinate indicates the rich factor corresponding to the pathway. (a) The H2 group vs. the sham group. (b) The EMP group vs. the sham group. (c) The EMP + H2 group vs. the EMP group.
