
Figure 3.
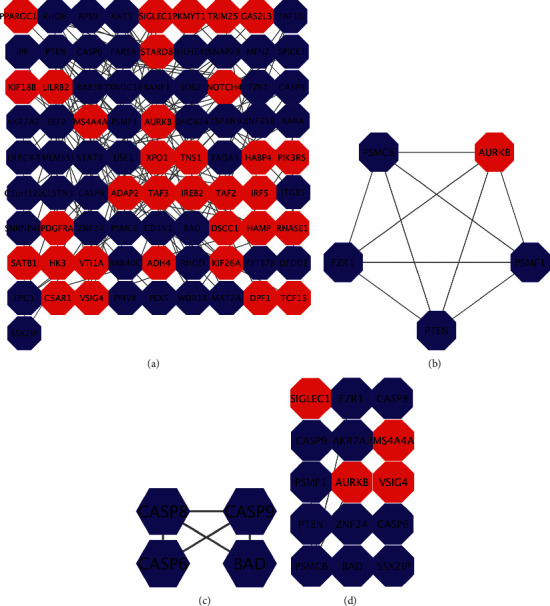
Module screening and functional analysis of the PPI network. (a) Protein-protein interaction network mapping the differentially expressed genes. (b) Module 1 generating from the PPI network. (c) Module 2 generating from the PPI network. (d) Shows fifteen hub genes with a high degree of connectivity. The red nodes represent upregulated DEGs, while the blue nodes represent downregulated DEGs. DEG: differential expression gene; PPI: protein-protein interaction.