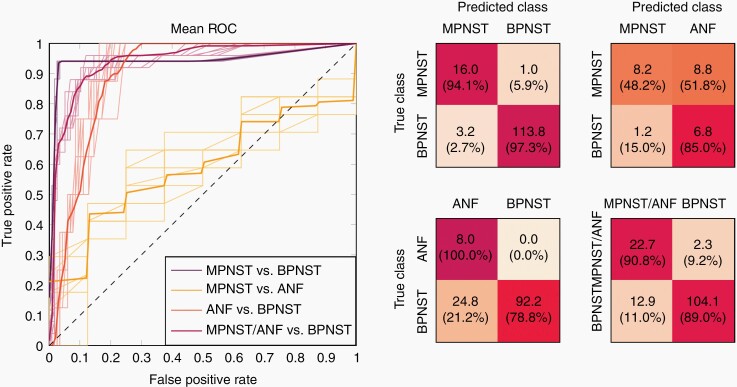
Figure 3.
ROC curves and confusion matrices for the considered classification problems. (Left) ROC curves for the considered classification problems: MPNST versus BPNST, ANF versus BPNST, MPNST versus ANF, MPNST/ANF versus BPNST. The bold lines represent the mean ROC curves of the repeated LOOCV runs, and the thin lines the corresponding individual runs. (Right) The confusion matrices show the mean numbers (absolute and, in parentheses, corresponding percentage values) of the repeated runs, evaluated for an optimal operating point according to Youden’s index.

