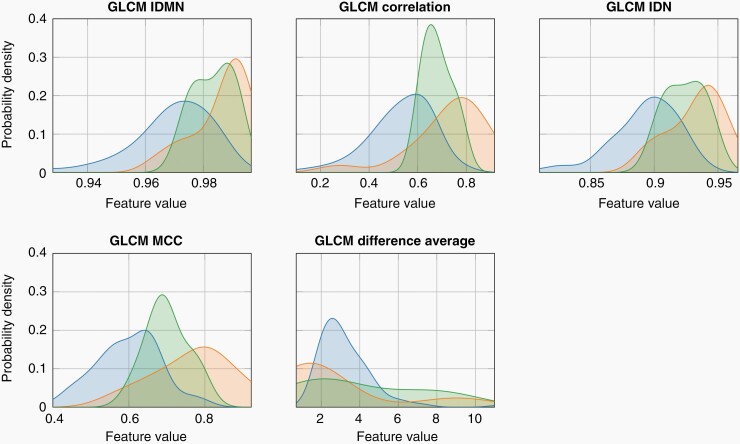
Figure 4.
Distributions of the defined radiomics signature features of the BPNSTs, the MPNSTs, and ANFs. In line with the clinical interpretation of ANFs as a histopathological premalignant precursor, the distributions of the ANF feature (green) lie in-between those of BPNSTs (blue) and MPNSTs (red). GLCM, gray level co-occurrence matrix; IDMN, inverse difference moment normalized; IDN, inverse difference normalized; MCC, maximal correlation coefficient.

