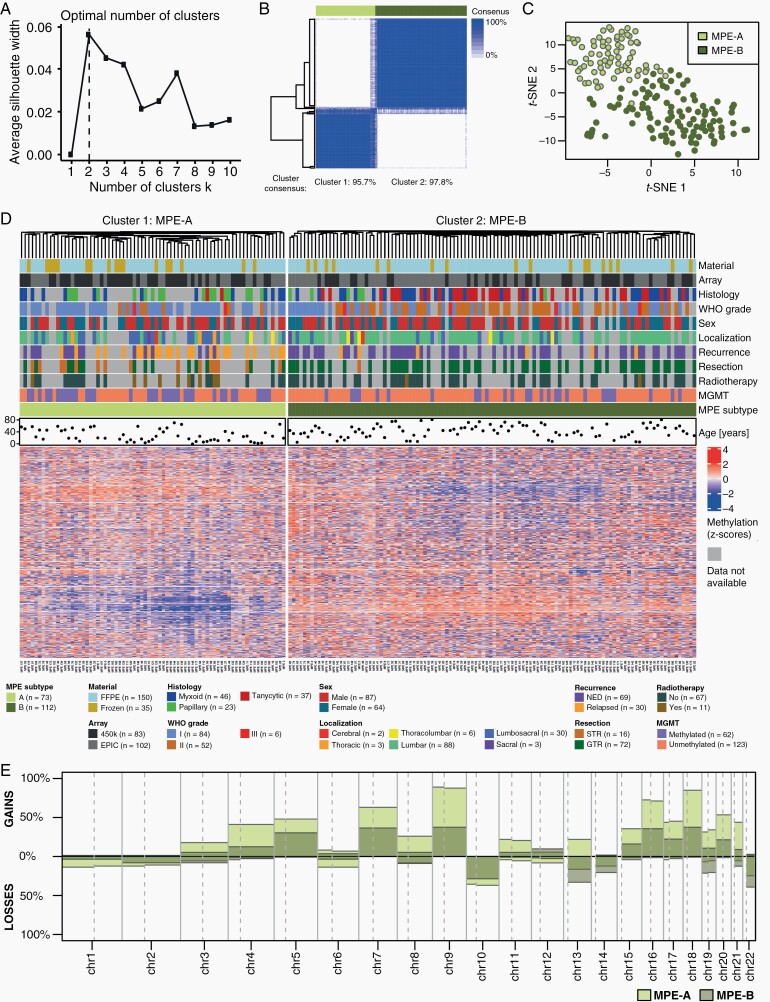
Fig. 2.
Methylation analysis of myxopapillary ependymoma. (A) Determination of the optimal number of methylation-based k-means clusters using the silhouette method. (B) Consensus clustering for the k-means algorithm. The column sidebar shows the k-means cluster for k = 2 with 10 000 CpG sites optimal in (A). (C) T-SNE analysis of methylation data. The colors represent the k-means cluster for k = 2 with 10 000, CpG sites. (D) Cluster analysis with heatmap of methylation data and clinicopathological variables of MPE (n = 185). (E) Overview of chromosome arm-wise copy number alterations in methylation-based subtypes of MPE.

