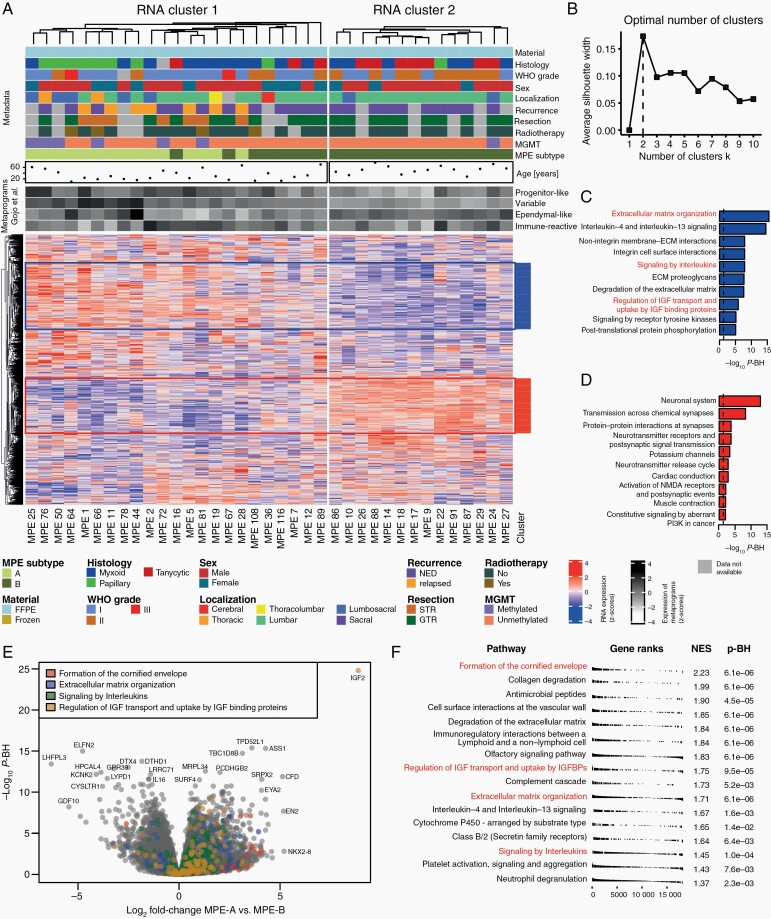
Fig. 3.
RNA sequencing analysis of myxopapillary ependymoma. (A) Heatmap analysis of RNA sequencing data, clinicopathological variables and expression of metaprograms defined by Gojo et al.23 in 37 MPE. The MPE subtype is based on k-means clustering of methylation data. The optimal number of clusters was determined by the silhouette method (B). Highly correlating gene clusters (R > 0.3, defined by cutting the row dendrogram) with at least 200 genes are annotated and subjected to gene set enrichment analysis (C–D). (E) Volcano plot of differential expression analysis with annotation of four gene sets. (F) Results of gene set enrichment analysis of differentially expressed genes between MPE subtypes.

