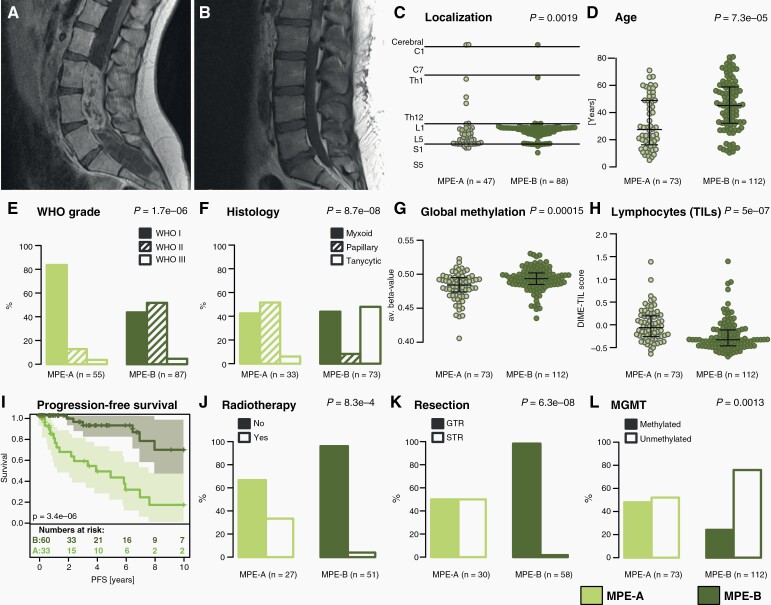
Fig. 4.
Clinicopathological and radiological features of MPE subtypes. (A–B) Exemplary MRI images of MPE subtype A and B, respectively (T1+CA). (C) Tumor localization of MPE subtypes along the neural axis. (D) Age distribution of MPE subtypes. (E–F) Distribution of WHO grades (2016) and main histological patterns in MPE subtypes. (G–H) Estimation of global DNA methylation level and tumor-infiltrating lymphocytes (TILs) in MPE subtypes. (I) Kaplan-Meier plot comparing PFS between MPE subtypes. (J–L) Distribution of patients having received adjuvant radiotherapy, postoperative resection status, and MGMT promoter methylation in MPE subtypes. Lines in beeswarm diagrams indicate the median, upper, and lower quartile. P-values assess differences between MPE subtypes.

