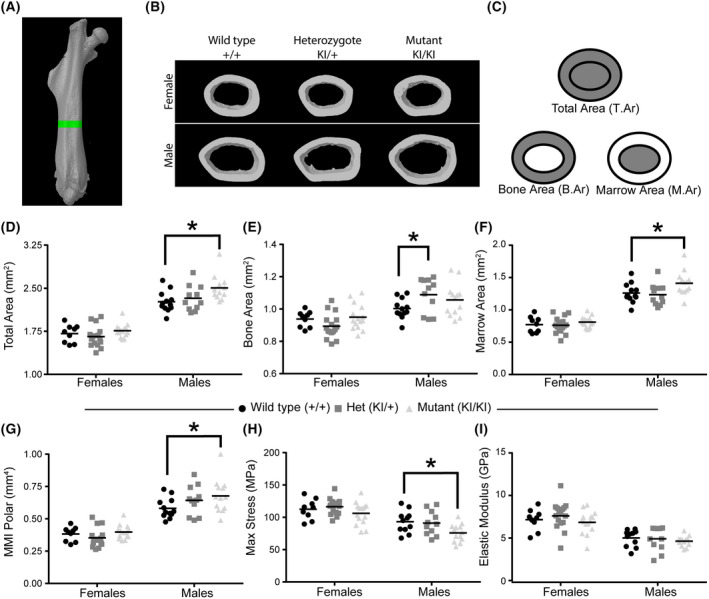
Fig. 3.

Enhanced cortical bone mass at 36 weeks in Lgals3‐R200S males. (A) Region of interest for cortical bone measurements, as assessed by μCT. (B) Representative cortical bone volumes of mice in each of the treatment groups. Images were selected based upon median Total Area measurements within each sex:genotype (C) Diagram showing areas represented by total area, bone area, and marrow area. Scatter plots from μCT data for total area (D), bone area (E), marrow area (F), and mean polar moment of inertia (MMI Polar; G). Scatterplots from derived tissue mechanical properties were measured by 4‐point bending, including max stress (H) and elastic modulus (I). The following number of samples were analyzed: Wildtype (+/+) female n = 9 and male n = 9, Het (KI/+) female n = 15 and male n = 11, and Mut (KI/KI) female n = 14 and male n = 13. Statistical significance determined after Holm‐Sidak post hoc analyses of 2‐way ANOVAs. Asterisks indicate a significant difference, *P < 0.05.
