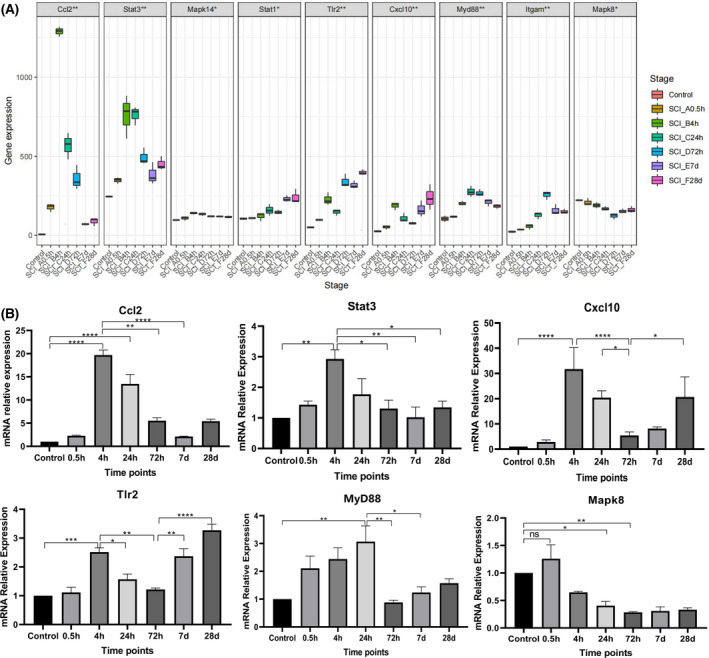
Fig. 4.

Dynamic expression of hub genes. (A) Trends in the temporal expression of hub genes. The ordinate shows the degree of gene expression, the bottom abscissa shows each timepoint, and the top abscissa shows the names of the genes. (B) The trends in the qPCR time‐series expression levels of various significant hub genes. Each timepoint is represented by the abscissa, and the ordinate shows the relative level of expression of genes relevant to the innate immune system. d, day; h, hour; Values are expressed as the means ± SEM. n = 3 for each group. Student's t‐test was used. ****P < 0.0001; ***P < 0.005; **P < 0.01; *P < 0.05. A P value < 0.5 was regarded as statistically significant.
