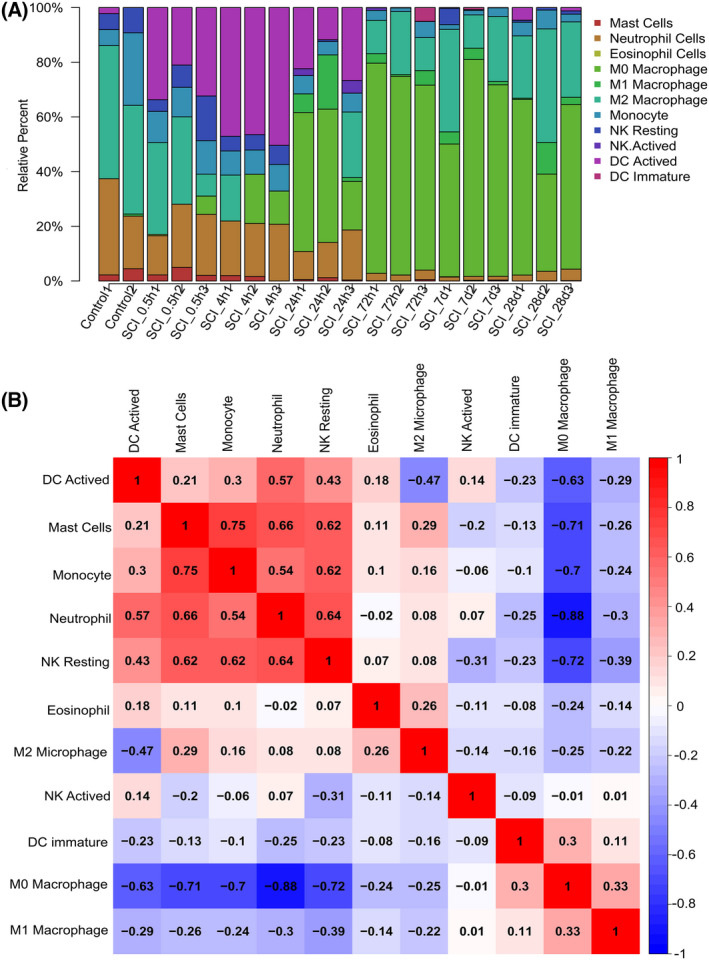
Fig. 5.

Infiltration of innate immune cells in spinal cord tissue after SCI. (A) The proportion of the 11 innate immune cell subgroups in SCI. Each GEO sample is represented on the X‐axis, and the percentage of each type of immune cell is represented on the Y‐axis. (B) Heatmap of correlation displaying 11 different types of innate immune cells. The square's color intensity conveys the correlation's strength. A positive correlation is denoted by red, whereas a negative correlation is denoted by blue. con, control; d, days; h, hours.
