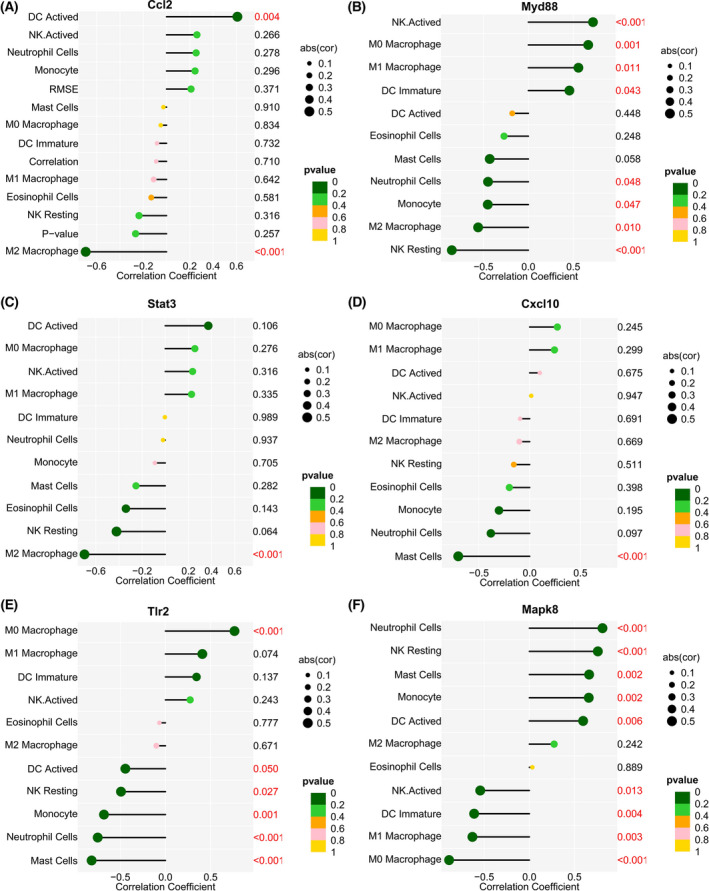
Fig. 6.

Correlation between innate immune‐related hub genes and innate immune cells. (A) Correlation between Ccl2 and innate immune cells. (B) Correlation between Myd88 and innate immune cells. (C) Correlation between Stat3 and innate immune cells. (D) Correlation between Cxcl10 and innate immune cells. (E) Correlation between Tlr2 and innate immune cells. (F) Correlation between Mapk8 and innate immune cells. The fraction of innate immune cells is represented by the ordinate on the left, the correlation test's P value is shown by the ordinate on the right, and the correlation coefficient is shown by the abscissa. The correlation coefficient is shown by the size of the circle, while the correlation test's P value is shown by the color of the circle. A P value < 0.5 was regarded as statistically significant.
