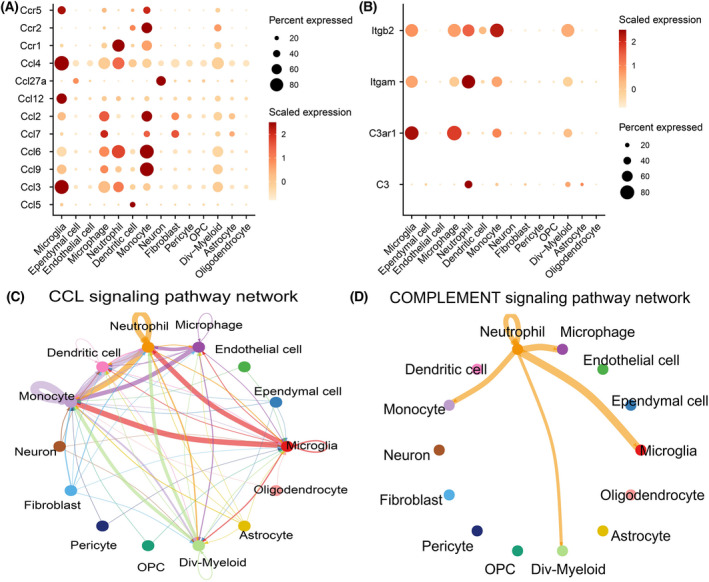
Fig. 8.

Cell communication in spinal cord after SCI. Expression of receptors and ligands in the CCL and COMPLEMENT signaling pathways (A) and (B). The diameter of the circle denotes the percentage of a cell type's cells that express a certain gene, and the intensity of the color denotes the degree of that expression. Between cells in the SCI, the CCL signaling pathway (C) and the COMPLEMENT signaling pathway (D). The strength of the signal is determined by the intercellular lines' thickness; the thicker the line, the stronger the signal intensity.
