Fig. 5.

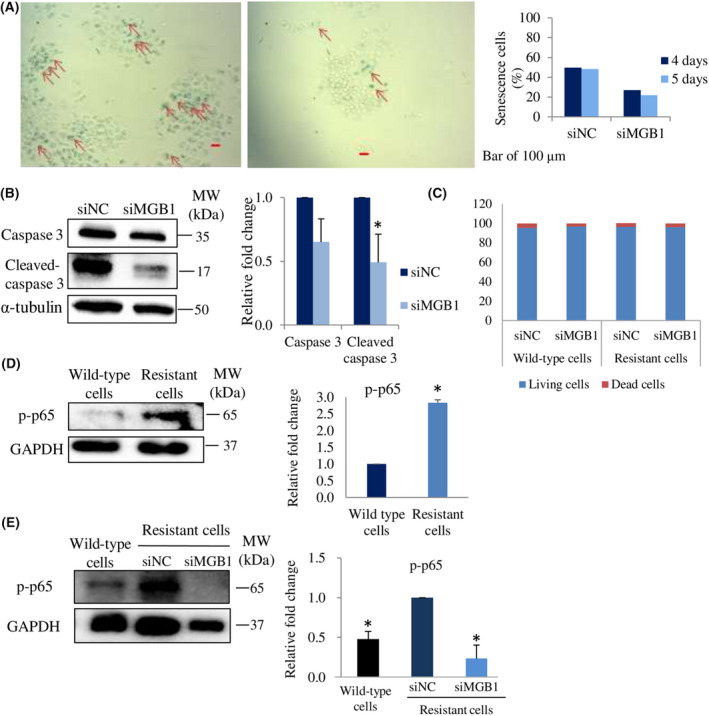
MGB1 does not regulate apoptosis and senescence cells but p‐p65 expression. (A) Representative images (left) of senescence cells (red arrow), and their quantification (number of senescence cells per 100 cells) 4 and 5 days posttransfection (right). Scale bar of 100 μm. (B) Representative western blots (left), and quantification (right) of caspase 3, cleaved caspase 3, and α‐tubulin (loading control) expression in resistant cells after siMGB1 transfection, relative to that of the negative control (siNC). (C) Graph bars showing the percentage of living cells and dead cells in wild‐type and the resistant group treated with siMGB1. (D) Representative western blots (left) and quantification (right) of p‐p65 and GAPDH (loading control) expression in resistant cells relative to that of wild‐type cells. (E) p‐p65 and GAPDH (loading control) expression in resistant cells after siMGB1 transfection, relative to that of the negative control (siNC). All statistical analysis in this figure is shown as the bar represents the mean with SEM, N = 3 independent experiments, once for each experiment. *Statistical significance was determined with 95% confidence interval.
