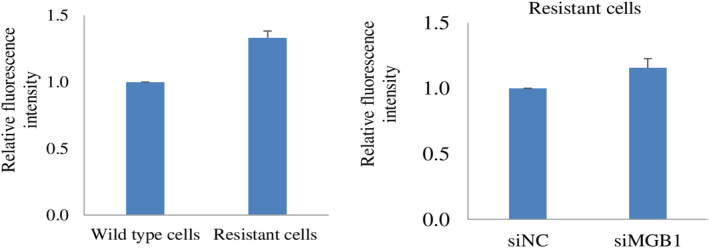
Fig. 8.

Detection of HER2 receptor in resistant cells and siMGB1‐treated resistant cells. Detection of HER2 receptor ectodomain by trastuzumab‐binding assay in resistant cells relative to wild‐type cells (left), and in siMGB1‐resistant cells relative to the negative control (right). The fluorescence intensity values indicate the binding of trastuzumab to the HER2 receptor. Graph bars represents mean ± SEM, N = 3 independent experiments, thrice for each experiment. No significant differences were observed in any of the comparisons.
