
Fig. 1.
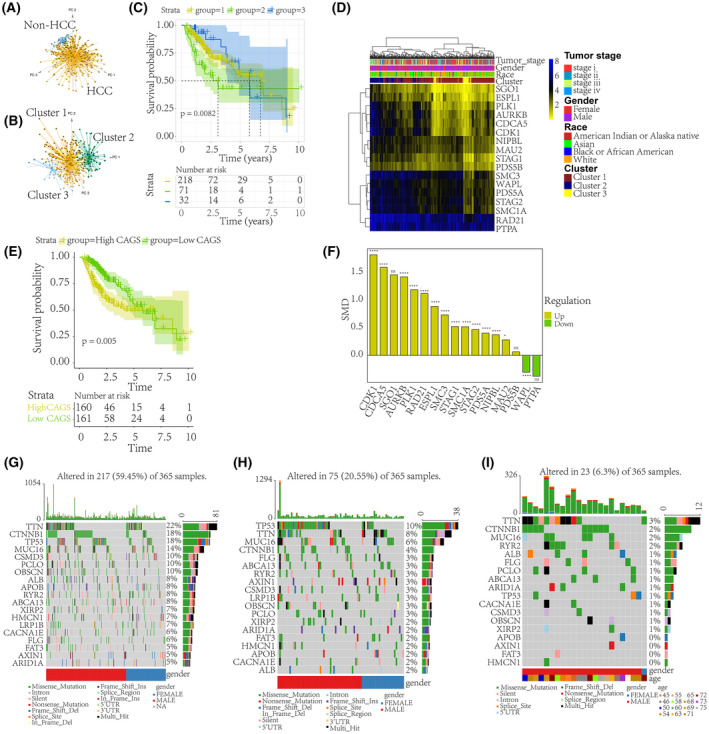
STAG1‐mediated distinct prognostic and mutation phenotypes in HCC. Given that STAG1 is a pivotal component of cohesin, it and 16 other CAGs were collected to explore their biological functions. (A) Using STAG1 and 16 other CAGs, HCC tissue samples could be preferably differentiated from adjacent normal liver tissue samples. (B) HCC patients were assigned to three clusters based on their cohesin‐associated signatures. (C) HCC patients classified into cluster 2 were found to have a worse survival outcome than the patients in the other clusters. A log‐rank test was used to identify the survival discrepancy. (D) The clinical characteristics of different HCC clusters. (E) The CAG signatures in each patient were quantified using single‐sample gene set enrichment analysis. The calculated values, termed CAGS, were used to classify the HCC patients. The low CAGS HCC patients displayed a significant survival advantage. A log‐rank test was used to identify the survival discrepancy. (F) Dysregulated expression levels of STAG1 and 16 other CAGs in the global HCC data (sample size: T AURKB = 3831, N AURKB = 3102; T CDCA5 = 3412, N CDCA5 = 2653; T CDK1 = 2347, N CDK1 = 1832; T ESPL1 = 3926, N ESPL1 = 3428; T MAU2 = 2141, N MAU2 = 1706; T NIPBL = 3334, N NIPBL = 2729; T PDS5A = 3081, N PDS5A = 2481; T PDS5B = 3055, N PDS5B = 2451; T PLK1 = 3414, N PLK1 = 3036; T PTPA = 384, N PTPA = 305; T RAD21 = 3395, N RAD21 = 3023; T SGO1 = 397, N SGO1 = 296; T SMC1A = 3386, N SMC1A = 3008; T SMC3 = 3306, N SMC3 = 2701; T STAG1 = 3313, N STAG1 = 2692; T STAG2 = 3414, N STAG2 = 3036; T WAPL = 425, N WAPL = 340, where T and N stand for HCC and non‐HCC group, respectively). Distinct mutation phenotypes of the three HCC clusters are shown in G–I, where TP53 is identified as the most frequently mutated gene in the HCC patients of cluster 2. CAG, cohesin‐associated gene; CAGS, cohesin‐associated gene scores; HCC, hepatocellular carcinoma; STAG1, stromal antigen 1. ****P value < 0.0001; *P value < 0.05; ns, not significant.