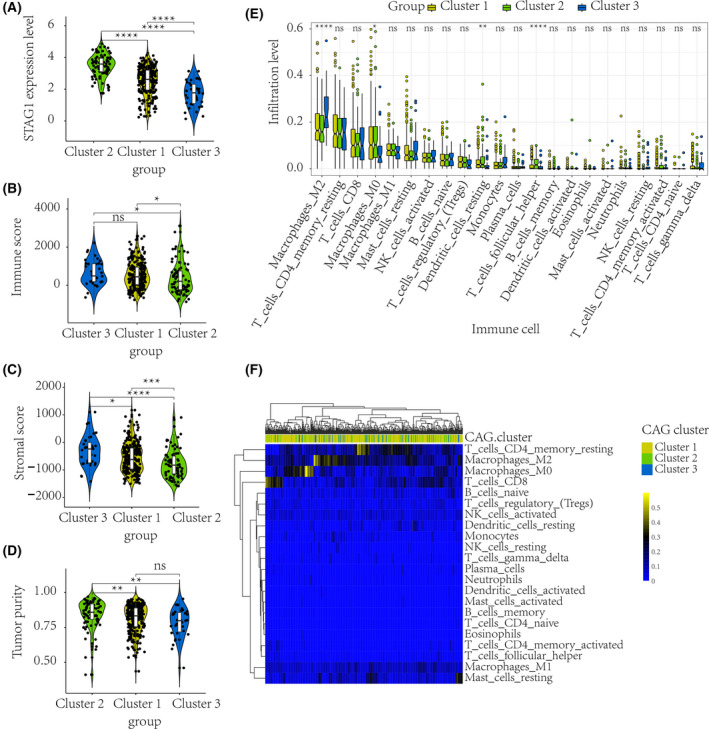
Fig. 2.

Distinct TME characterization of HCC patients. According to the identified CAG clusters, the TME characteristics of different HCC patients were compared. A Wilcoxon test was used to compare the intercluster immune and stromal scores (sample size: Ncluster1 = 251; Ncluster2 = 85; Ncluster3 = 35). The STAG1 mRNA expression level was significantly higher in CAG cluster 2 (A). HCC patients in CAG cluster 2 with poor prognosis exhibited prominently lower immune scores and stromal scores (B–C), and possessed higher tumor purity (D) than the other HCC patients. An ANOVA method was used to compare the immune infiltration levels among three clusters (sample size: Ncluster1 = 251; Ncluster2 = 85; Ncluster3 = 35). HCC patients in CAG cluster 2 also showed higher infiltration levels of resting dendritic and T follicular helper cells (E–F). HCC, hepatocellular carcinoma; CAG, cohesin‐associated gene; TME, tumor microenvironment. ****P value < 0.0001; ***P value < 0.001; **P value < 0.01; *P value < 0.05; ns, not significant.
