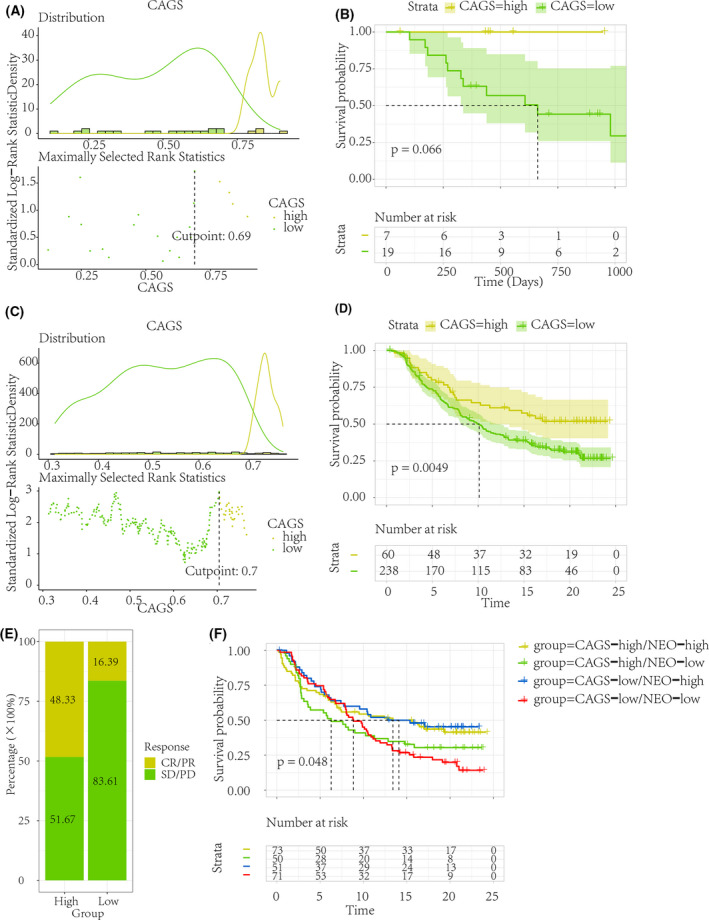
Fig. 3.

Prediction of immune checkpoint blockage therapy response. To detect the potential ability of CAGS in predicting ICB treatment response, the CAGS were quantified using IMvigor210 urothelial cancer and GSE78220 melanoma ICB cohorts. Patients with high CAGS exhibited a better overall survival condition than that with low CAGS in both the anti‐PD‐1 (GSE78220, A–B) and anti‐PD‐L1 (IMvigor210, C–D) ICB therapy cohorts. (E) The high CAGS group had a higher responsive rate (response/nonresponse = 48.33%/51.67%) to ICB treatment than the low CAGS group (response/nonresponse = 16.39%/83.61%). (F) Overall survival analysis of ICB therapy cohorts based on both CAGS and NEO status. CAGS, cohesin‐associated gene scores; ICB, immune checkpoint blockage; NEO, neoantigen burden.
